Lorem ipsum dolor amet, consect adipiscing elit, diam nonummy.

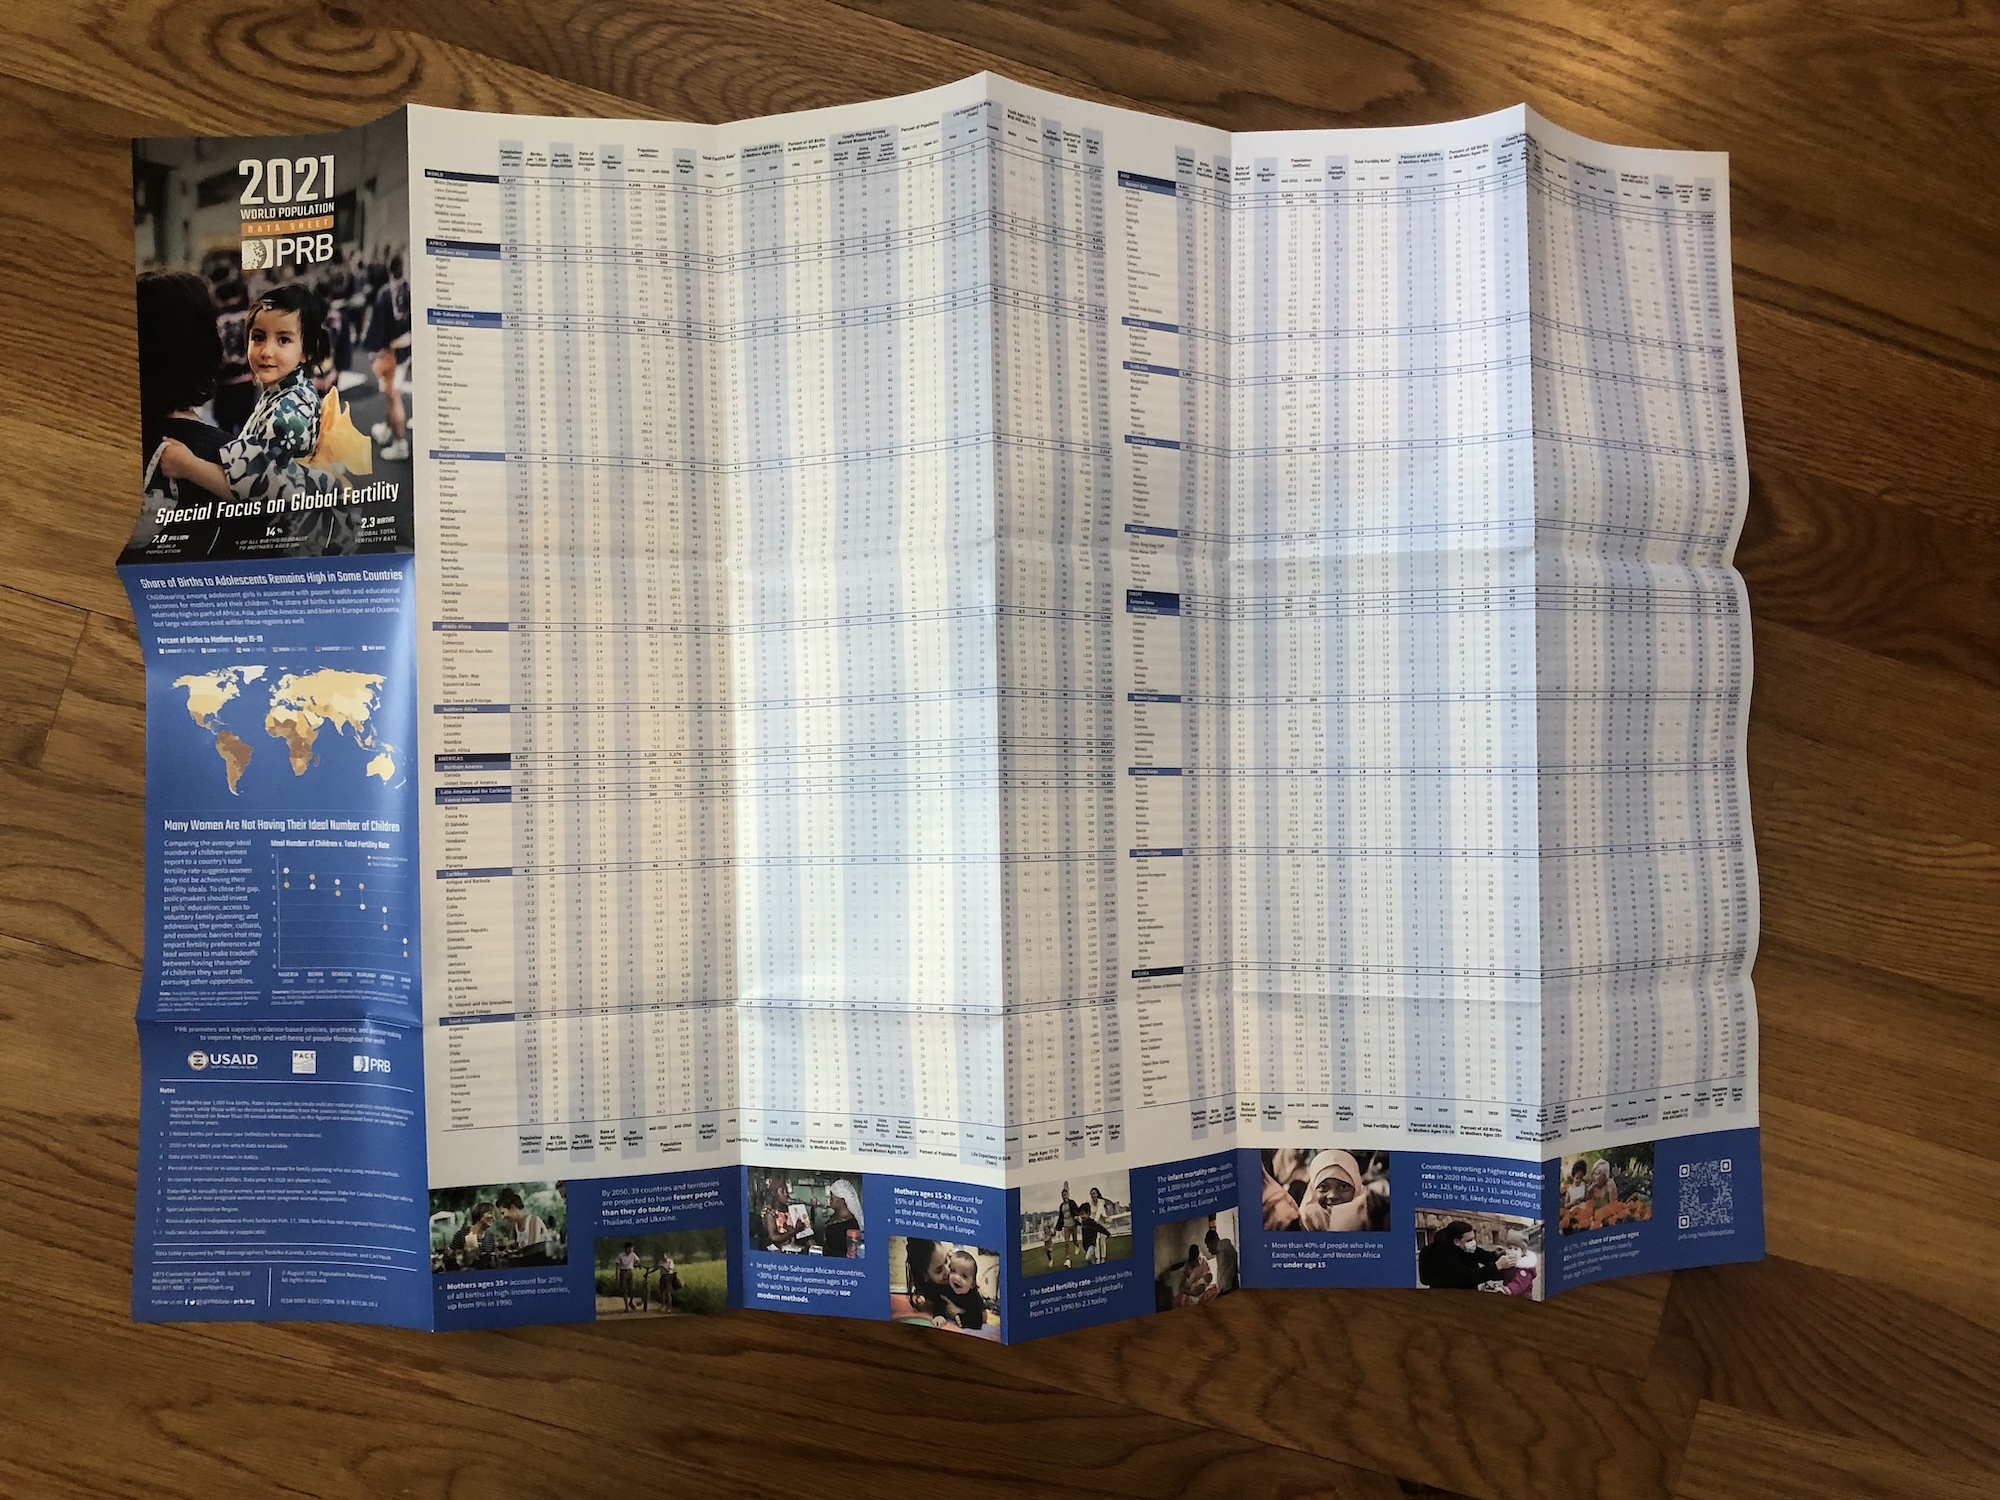
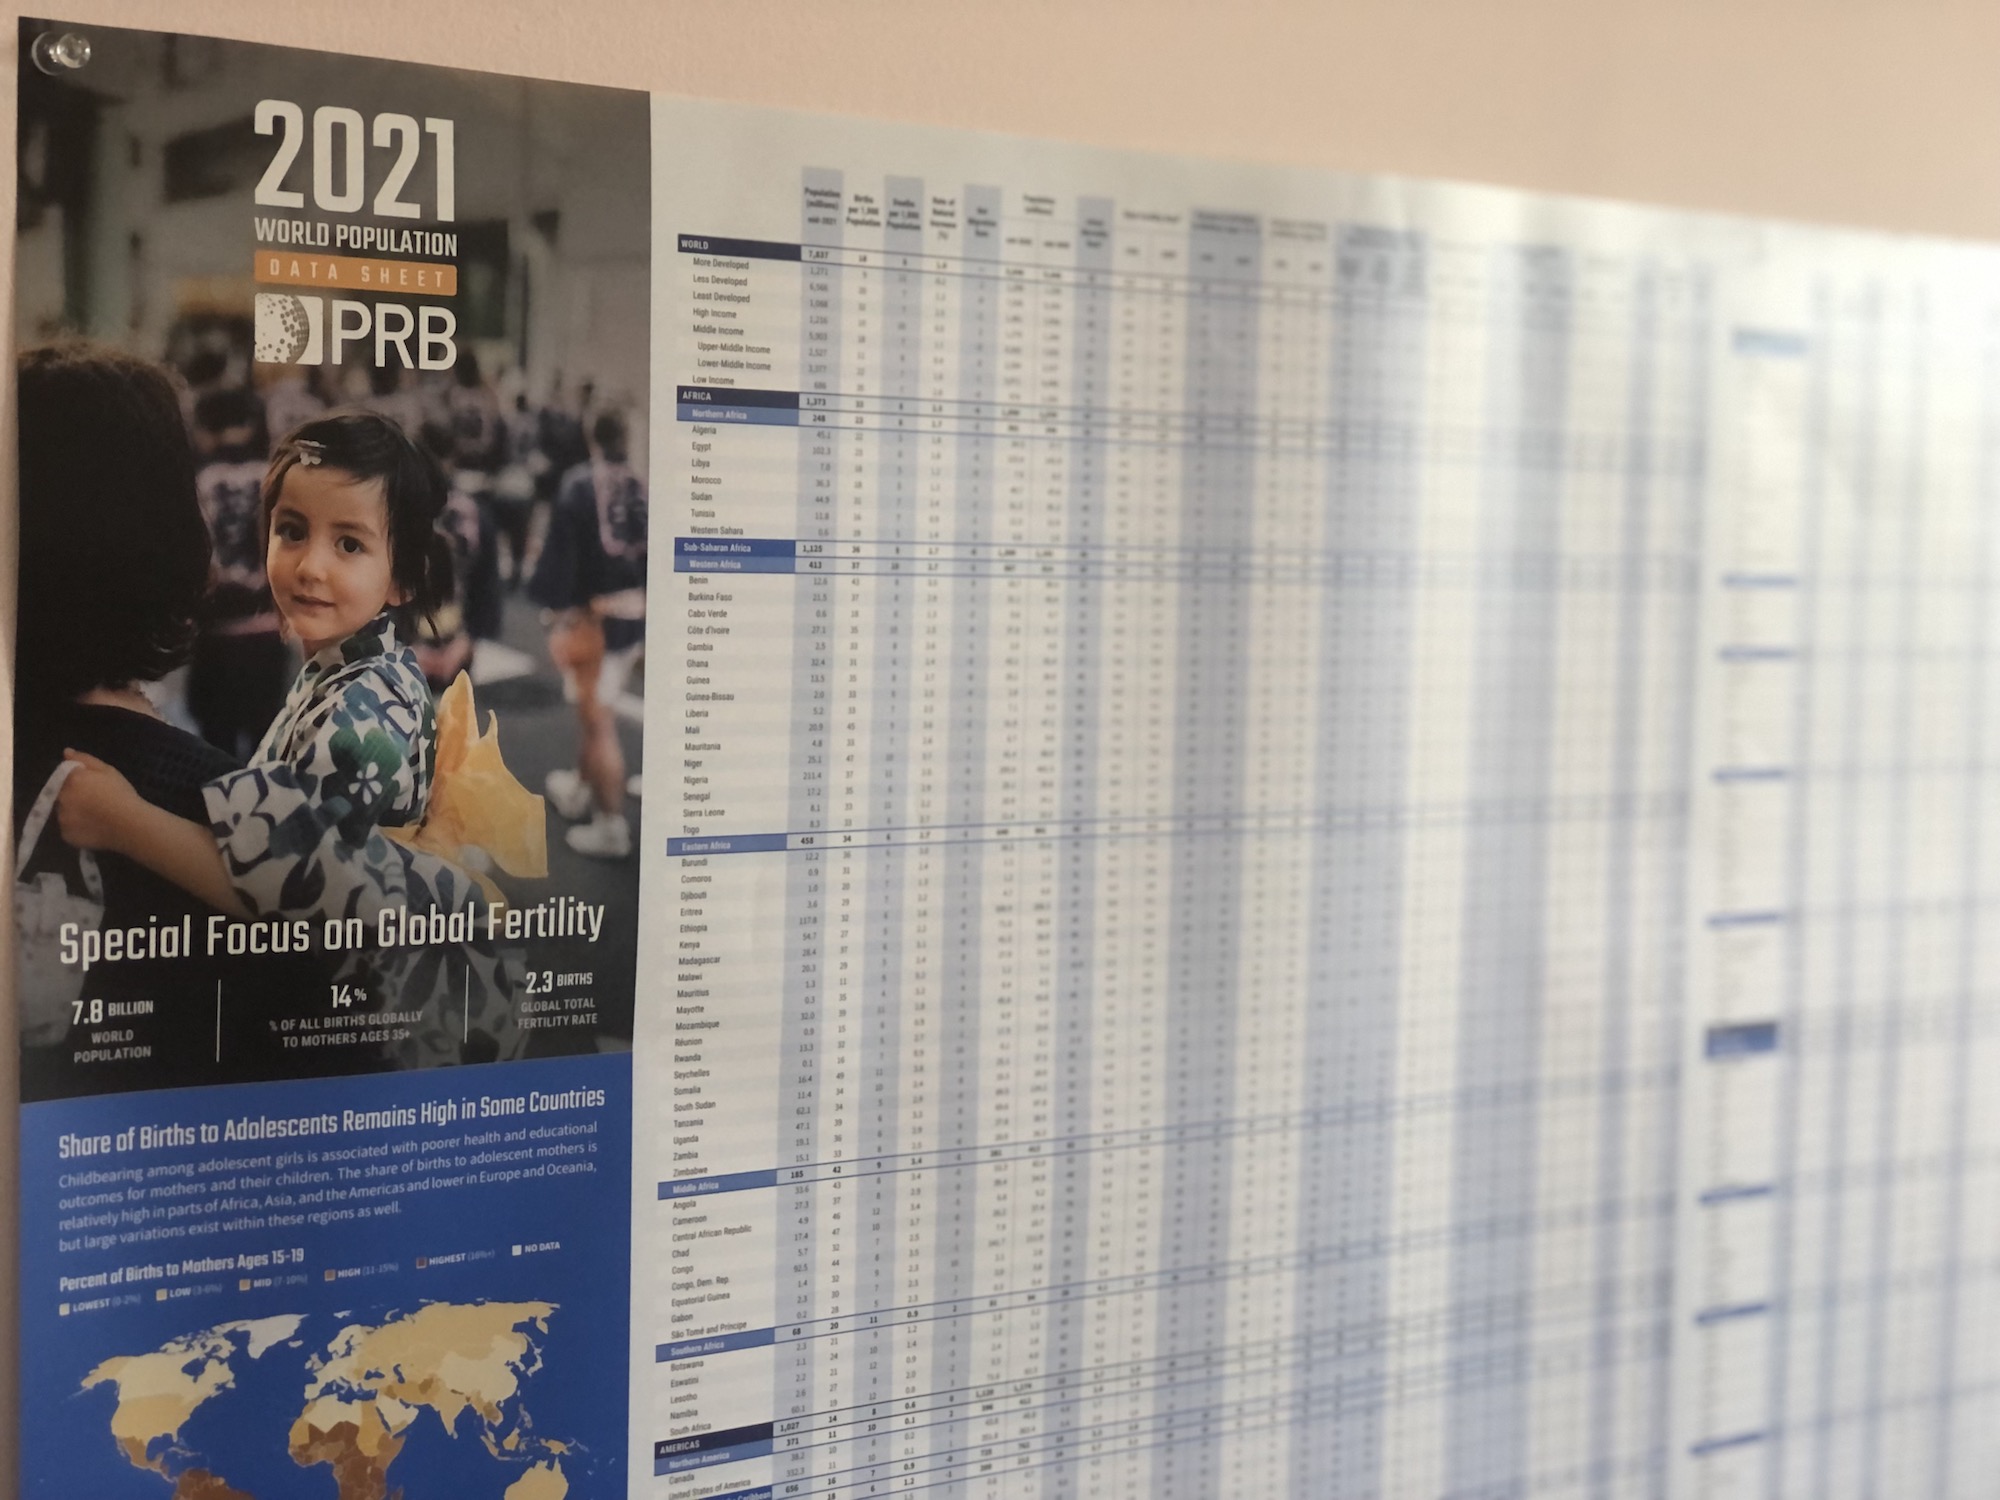
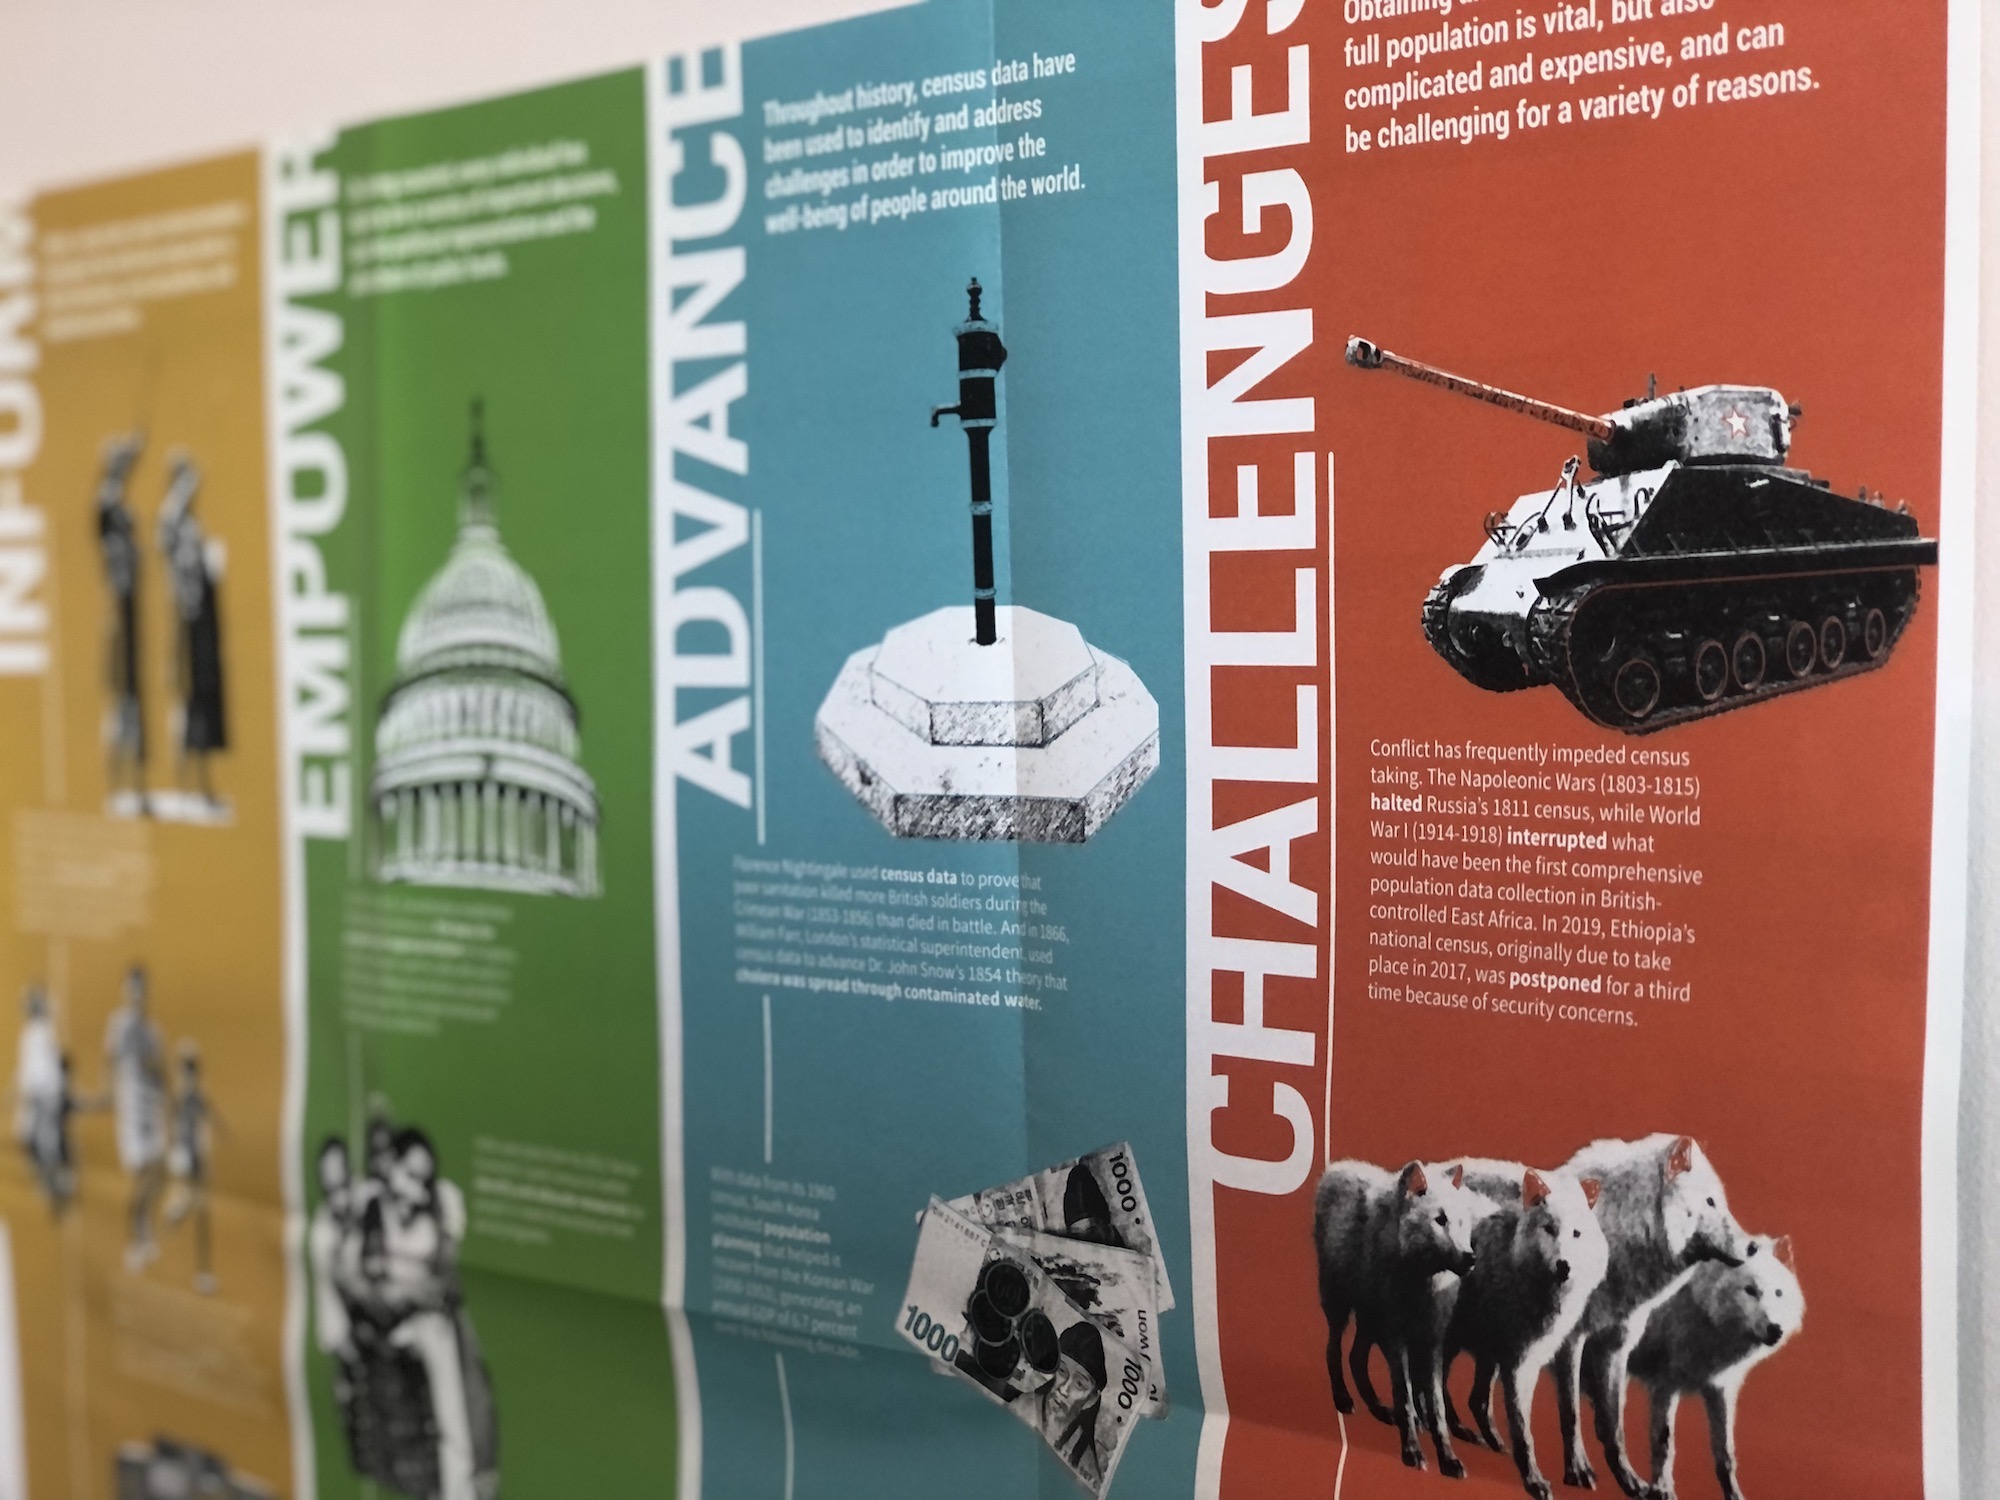
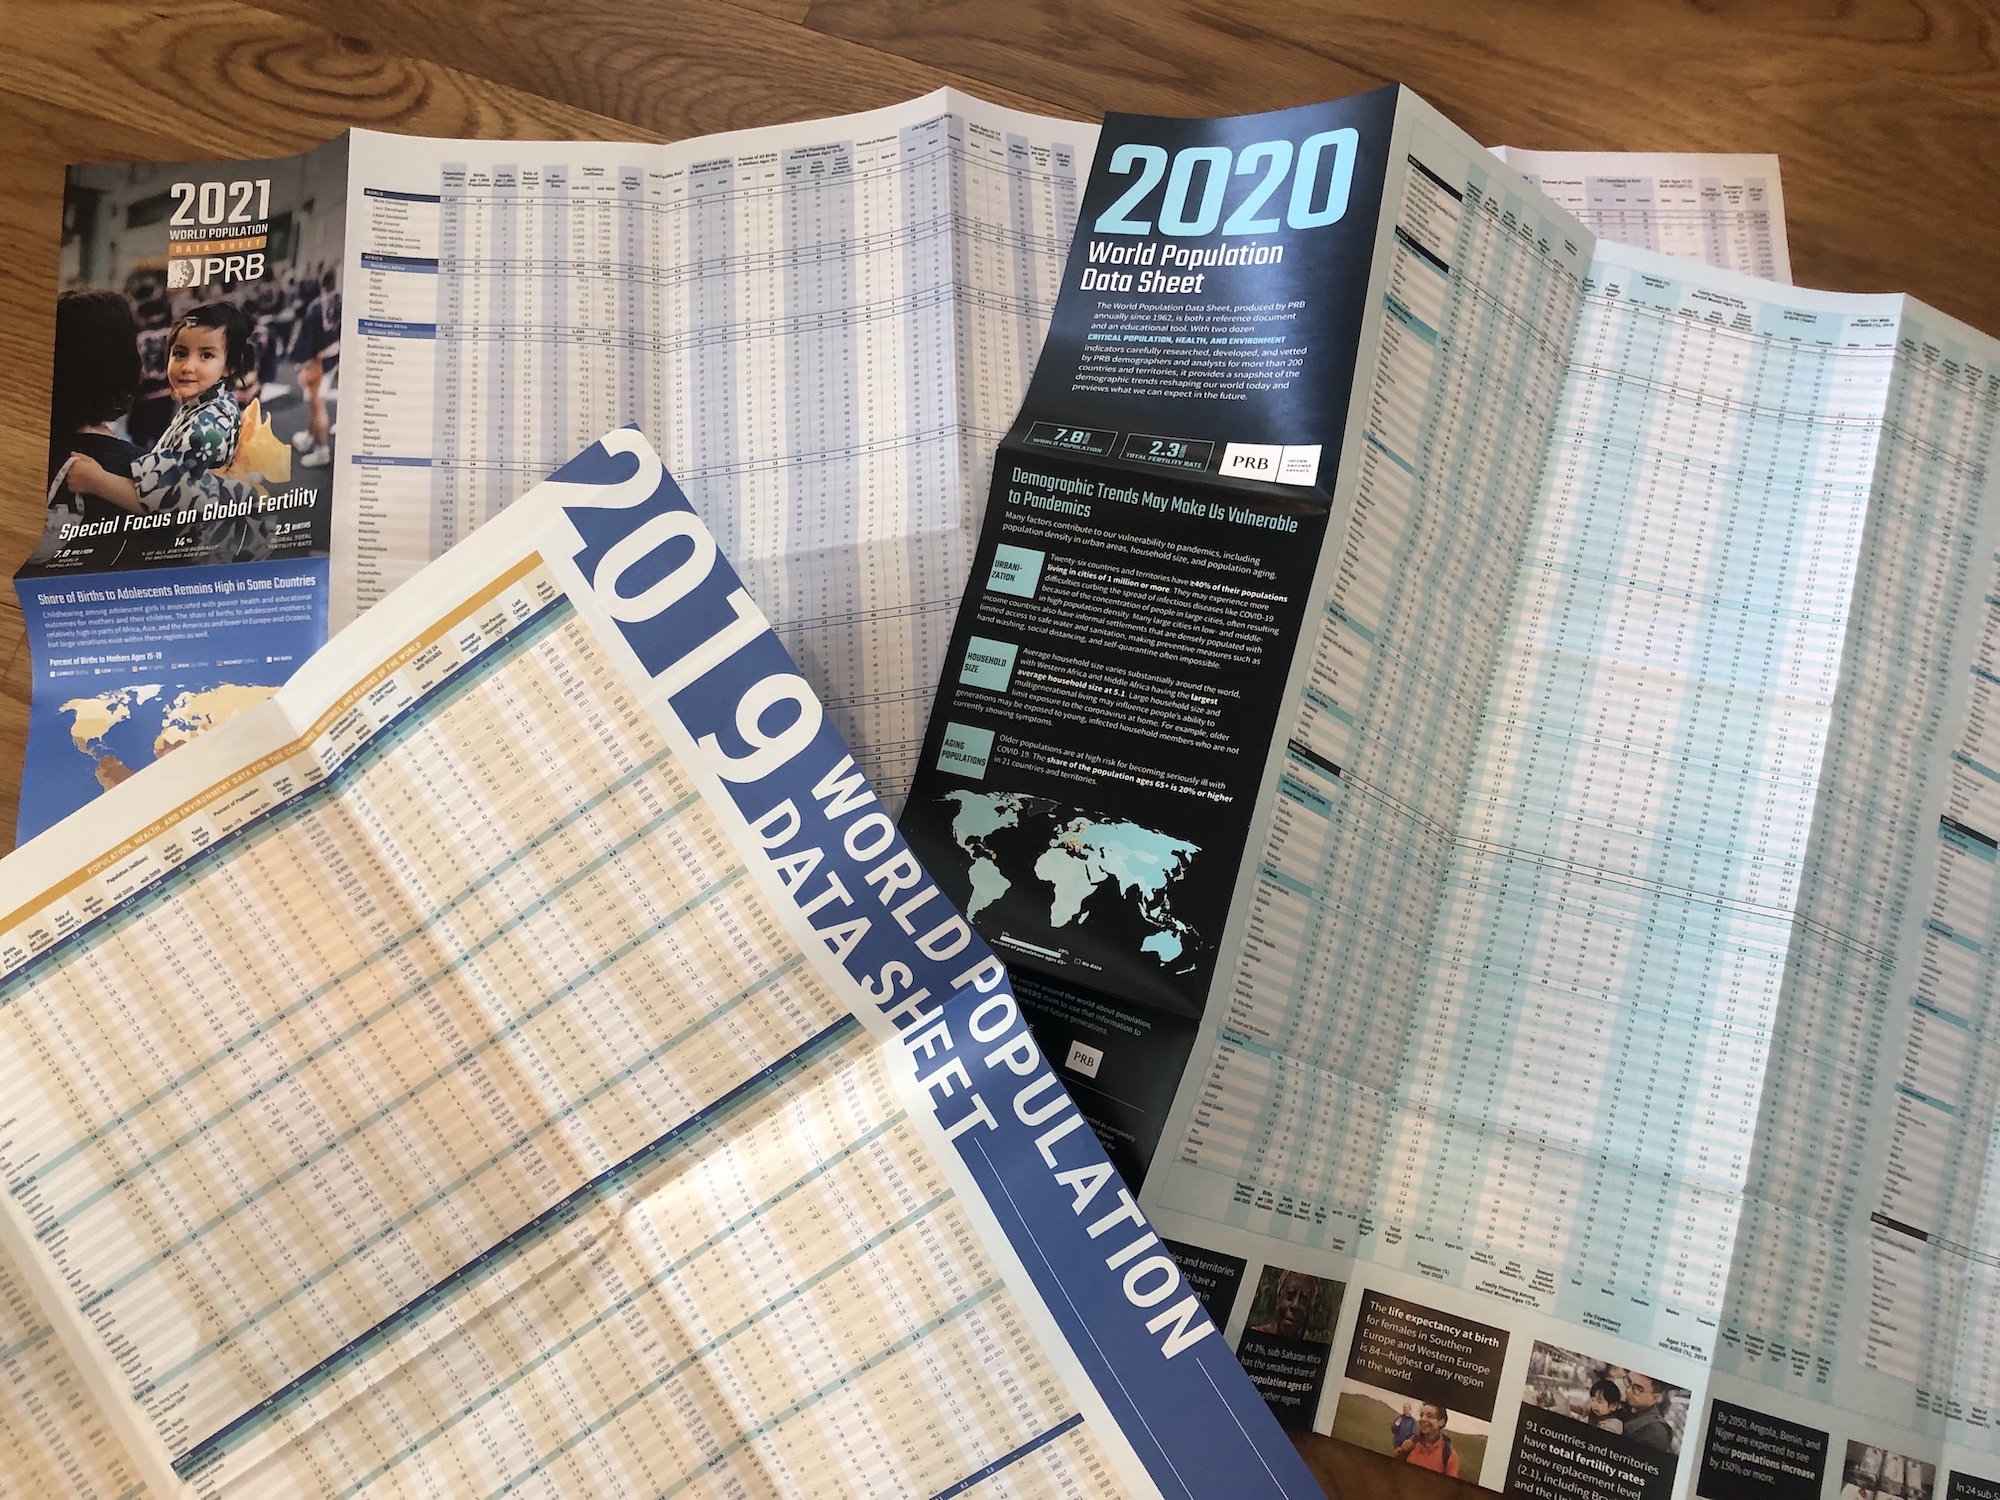
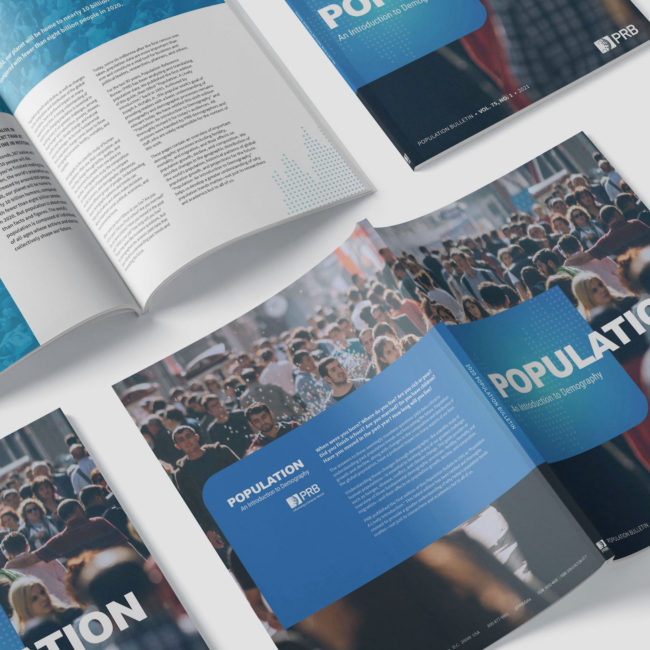
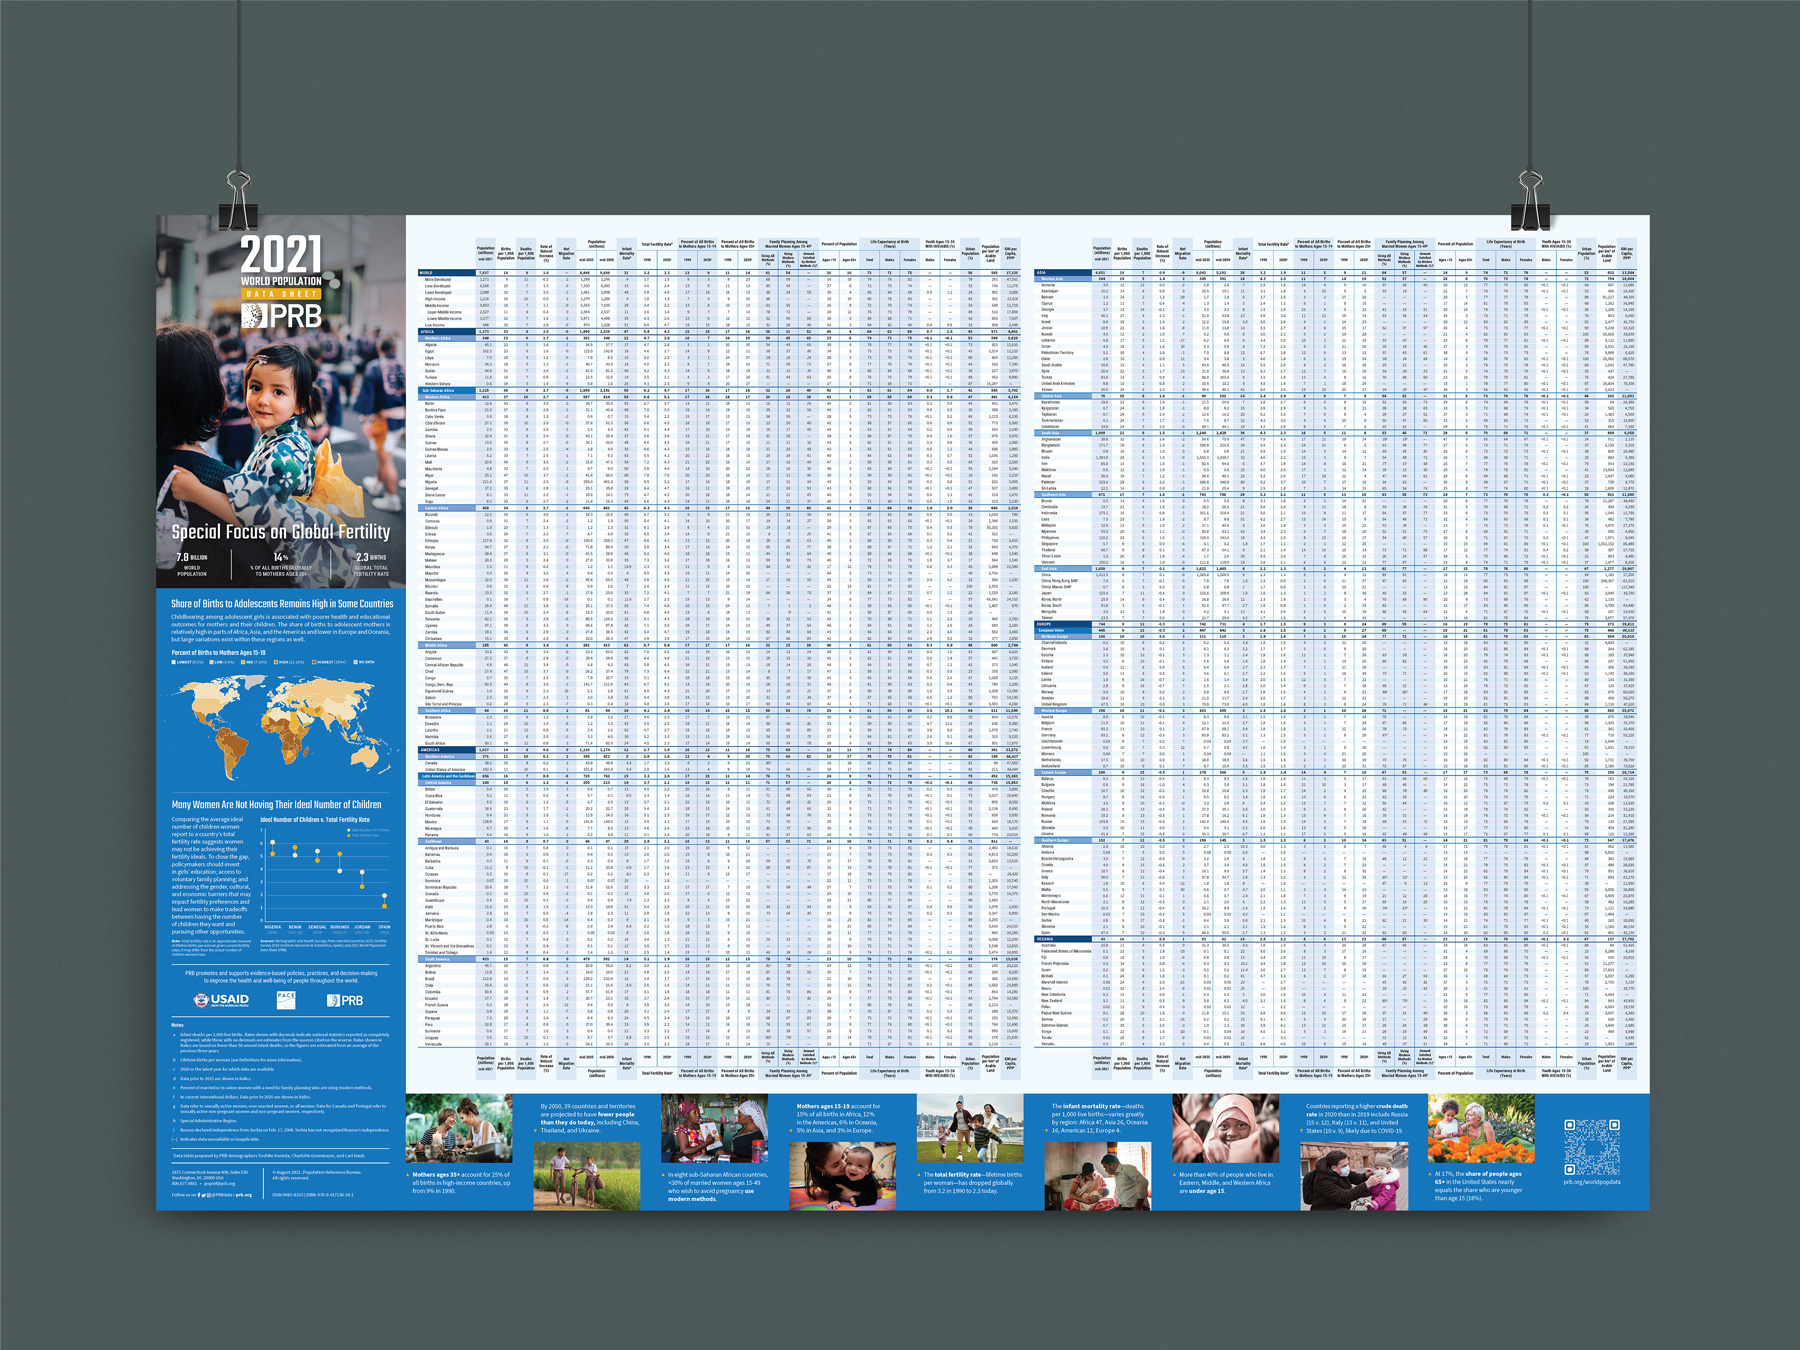
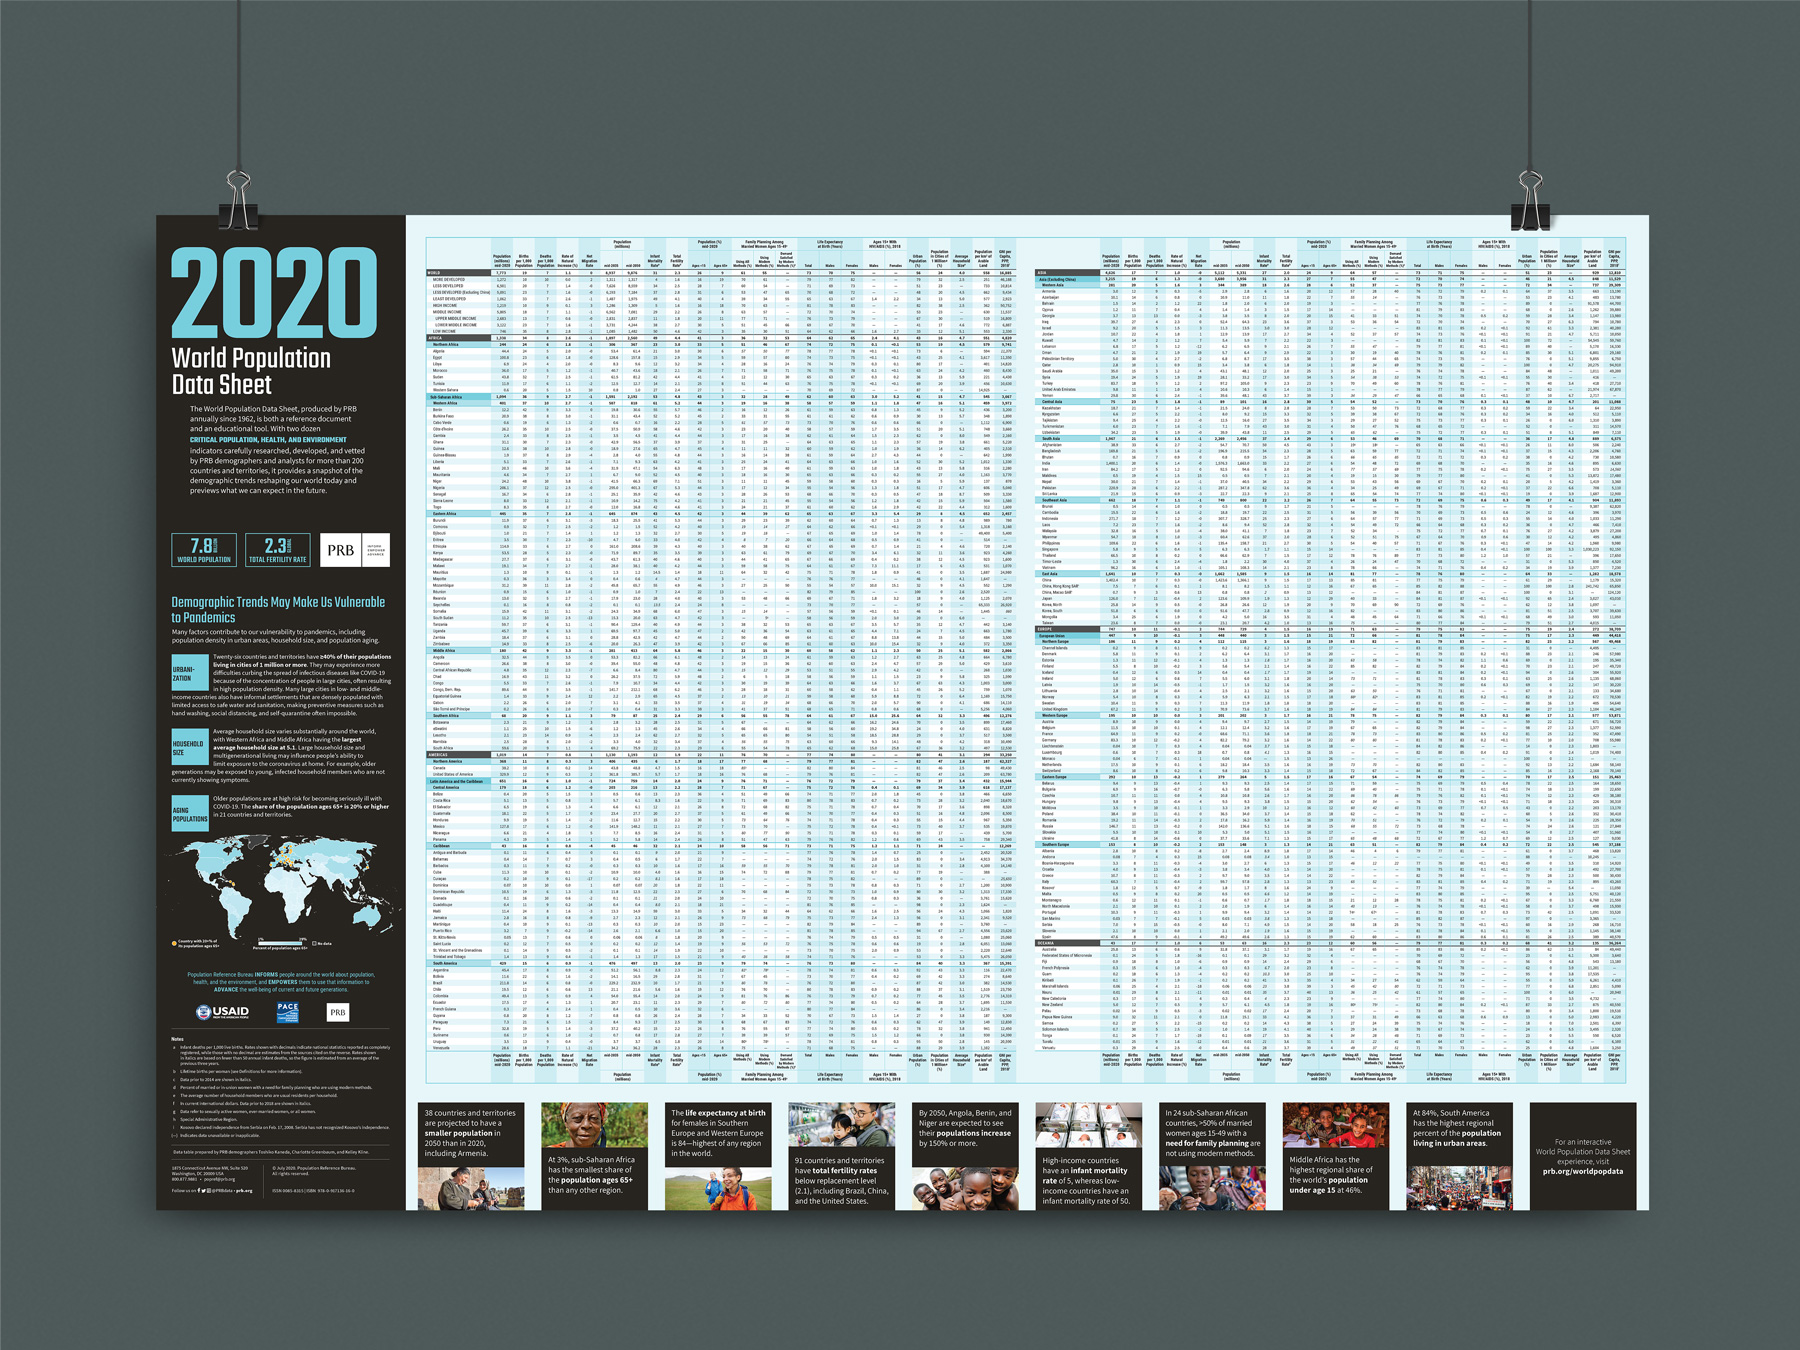
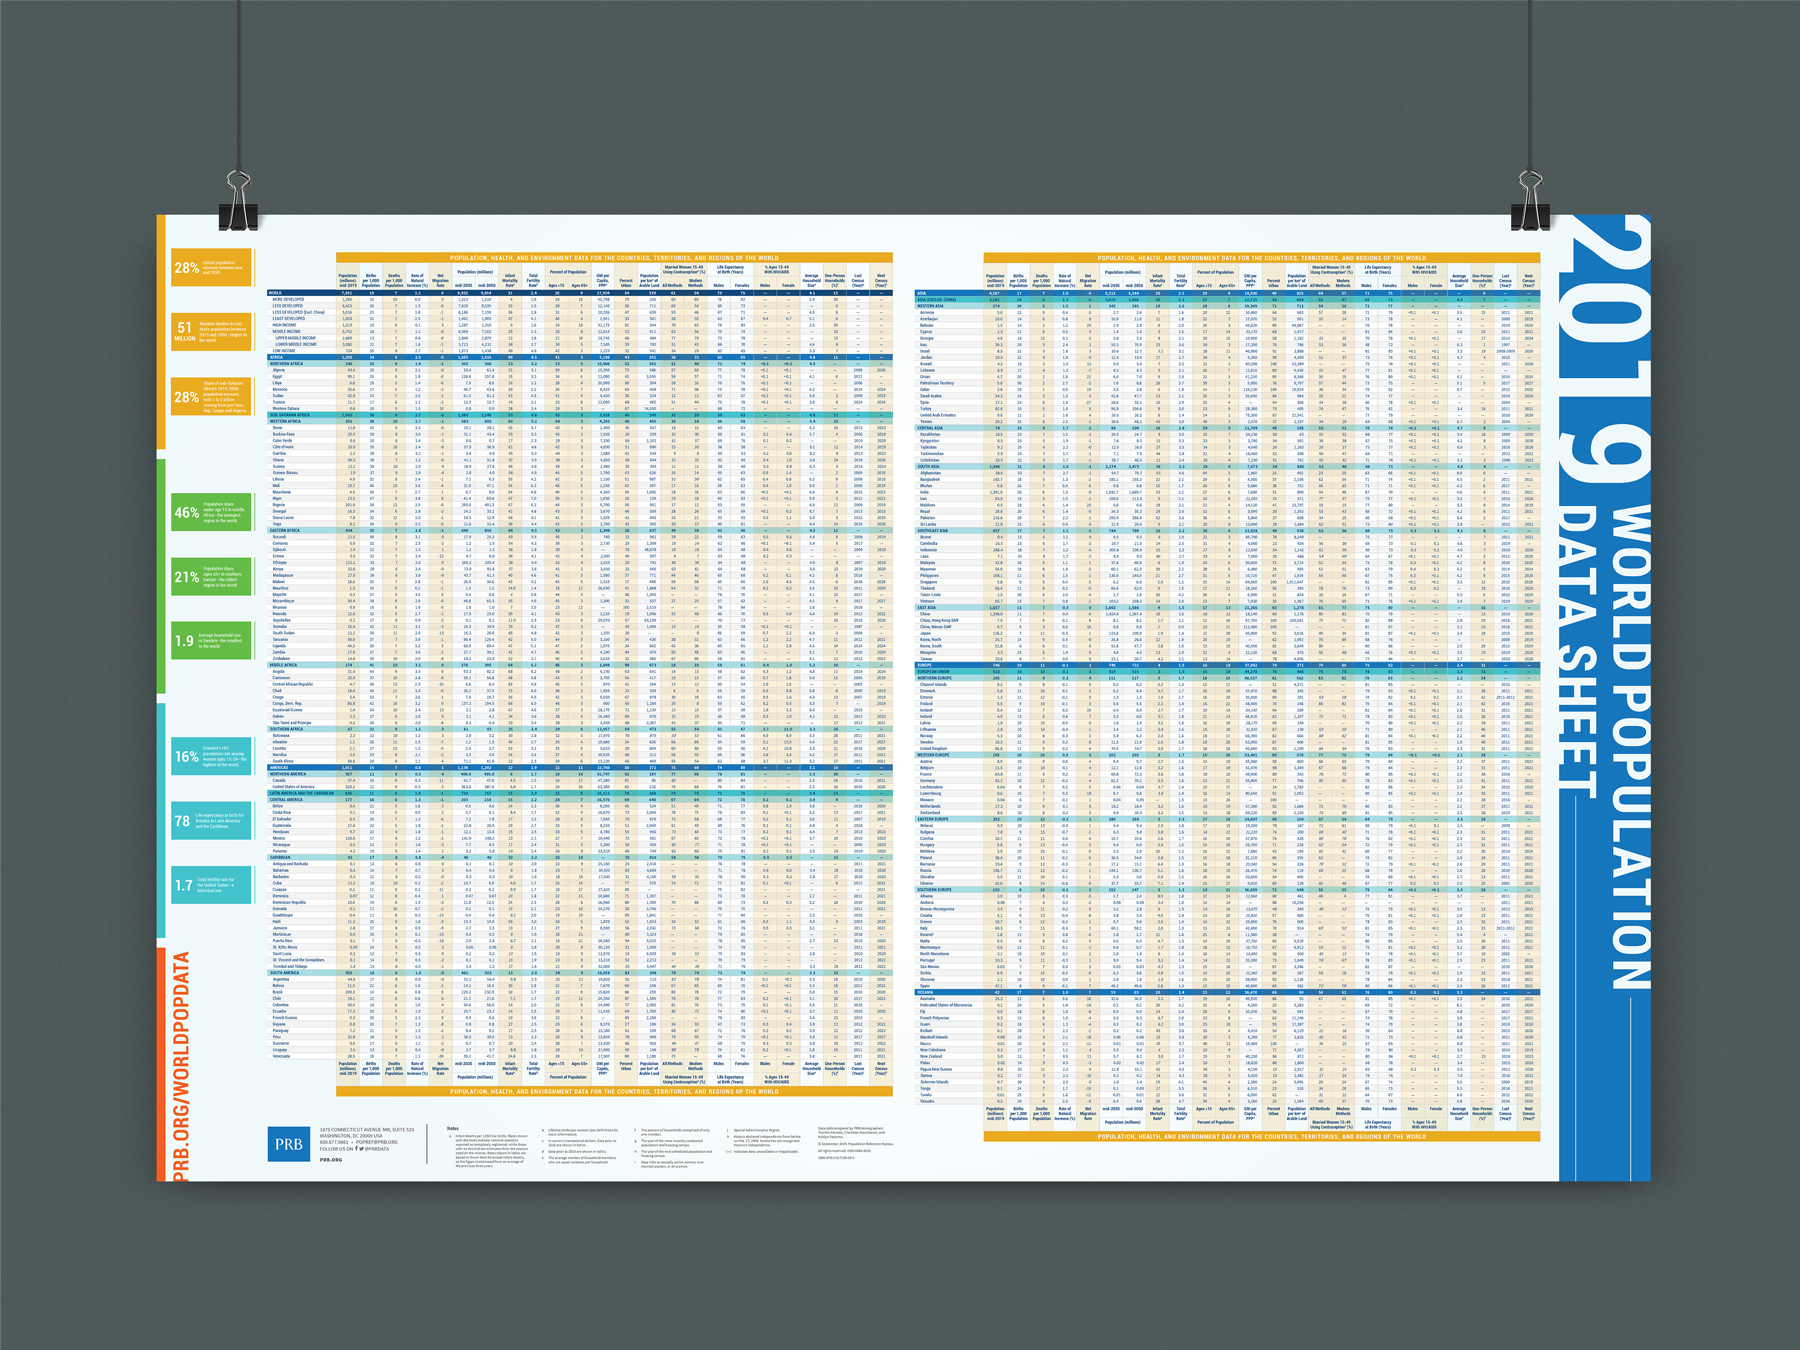
The World Population Data Sheet has been PRB’s flagship product since the 1960s and is packed with demographic data from every country around the world–collated by PRB researchers.
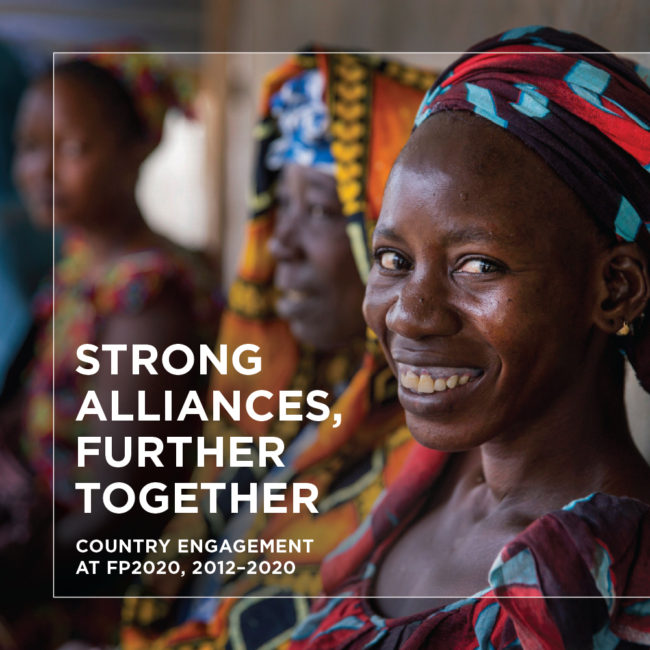
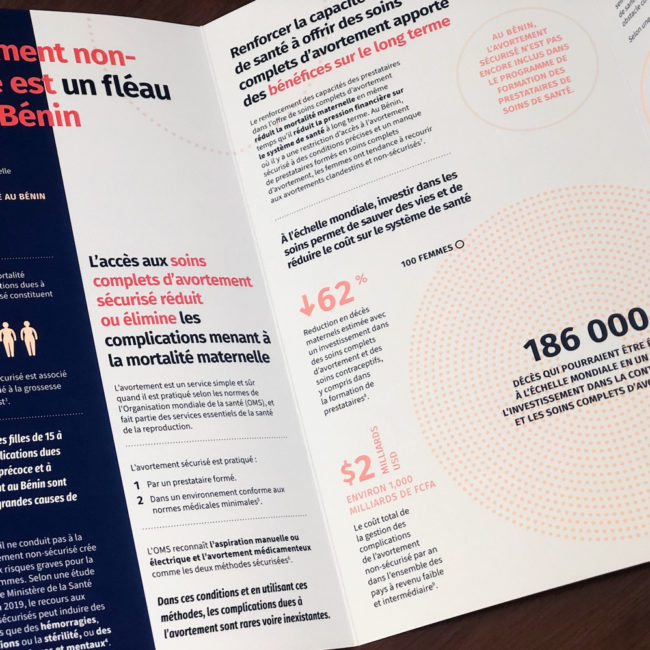
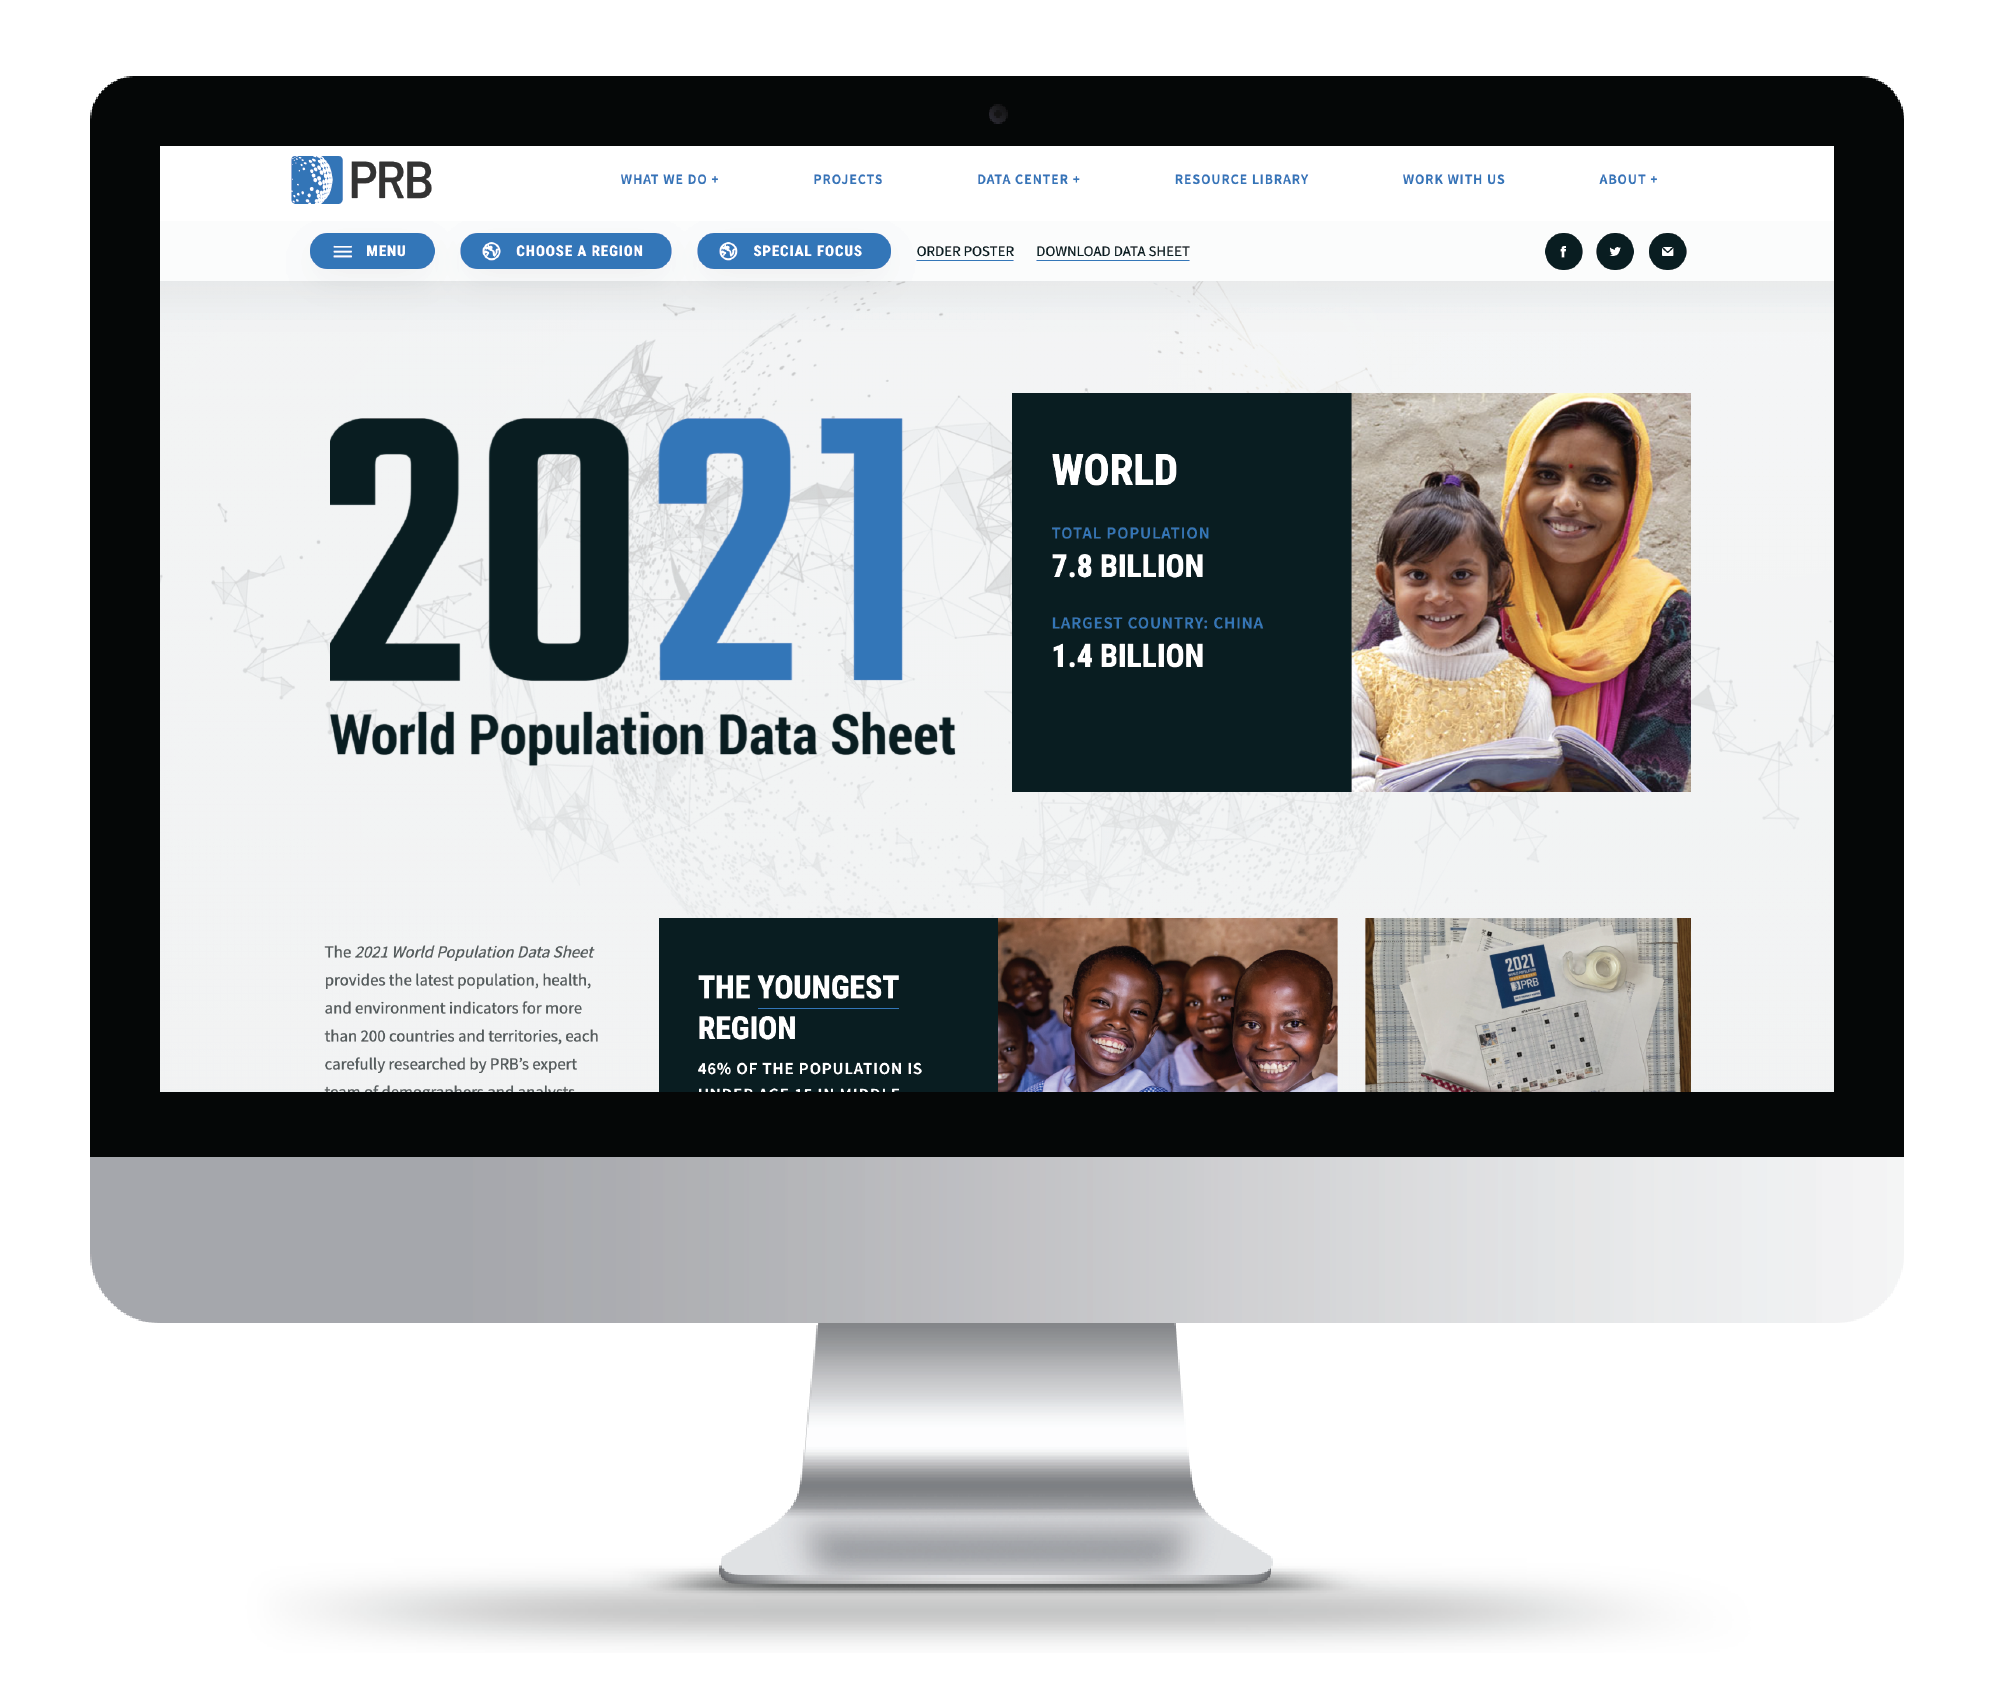
As the lead designer for the 2019, 2020, 2021, and 2022 World Population Data Sheets, I created the poster design by working with the Creative Director to ensure the poster and the complementary web feature had a cohesive digital and print look and feel. I also meticulously formatted the thousands of data points that comprise this poster, led photo research and editing, and designed the additional print products surrounding this suite of materials.
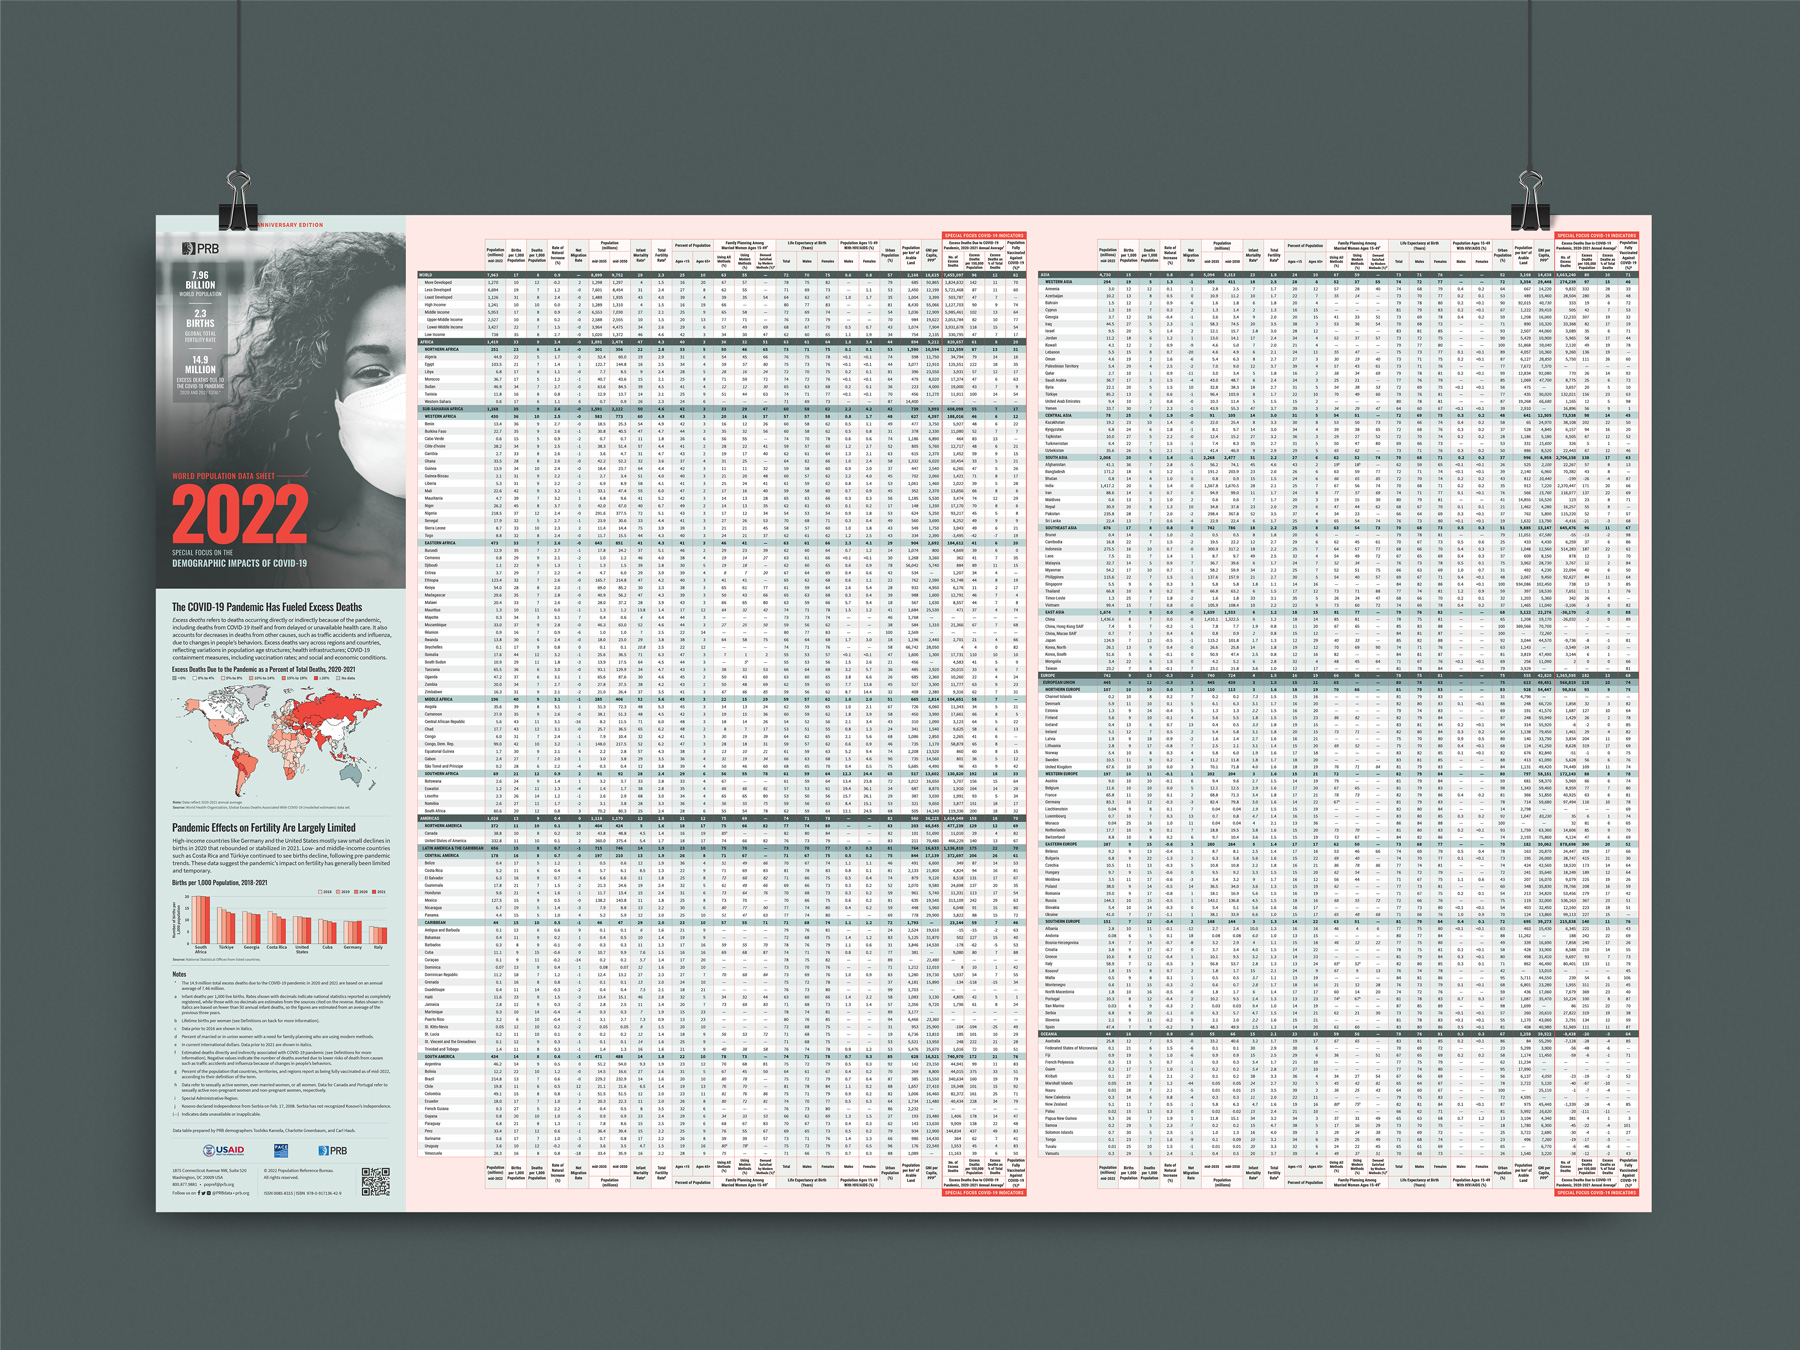
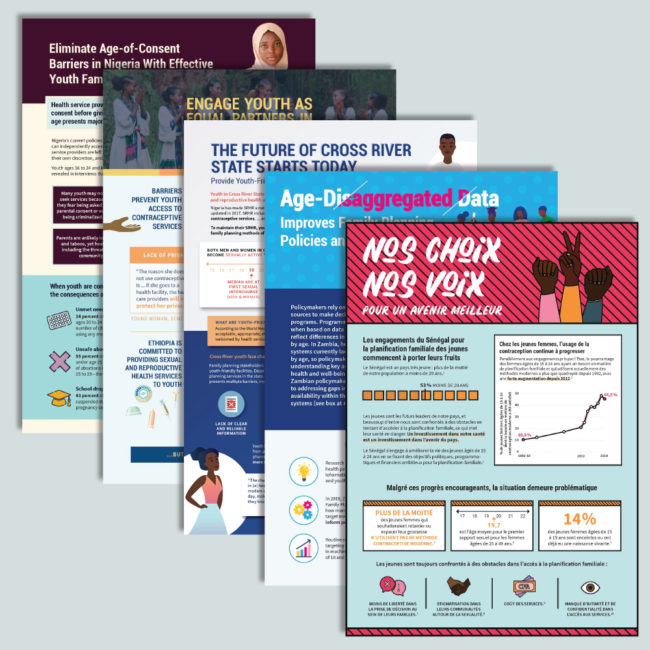
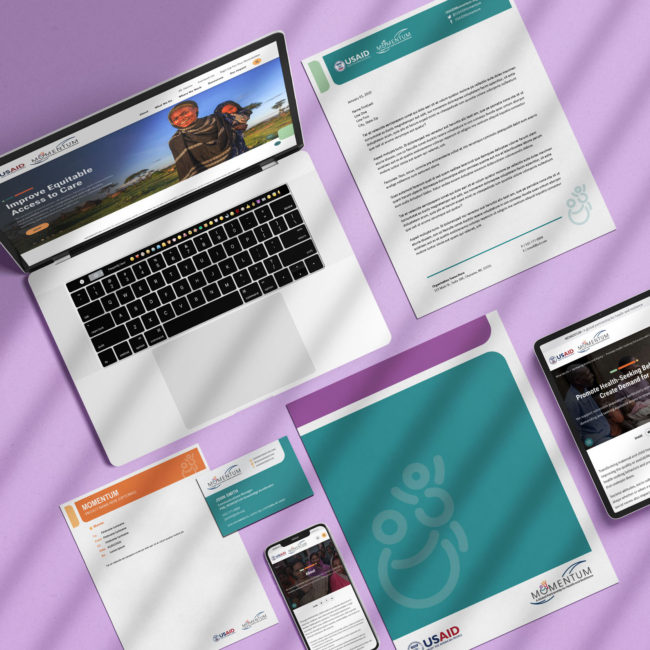
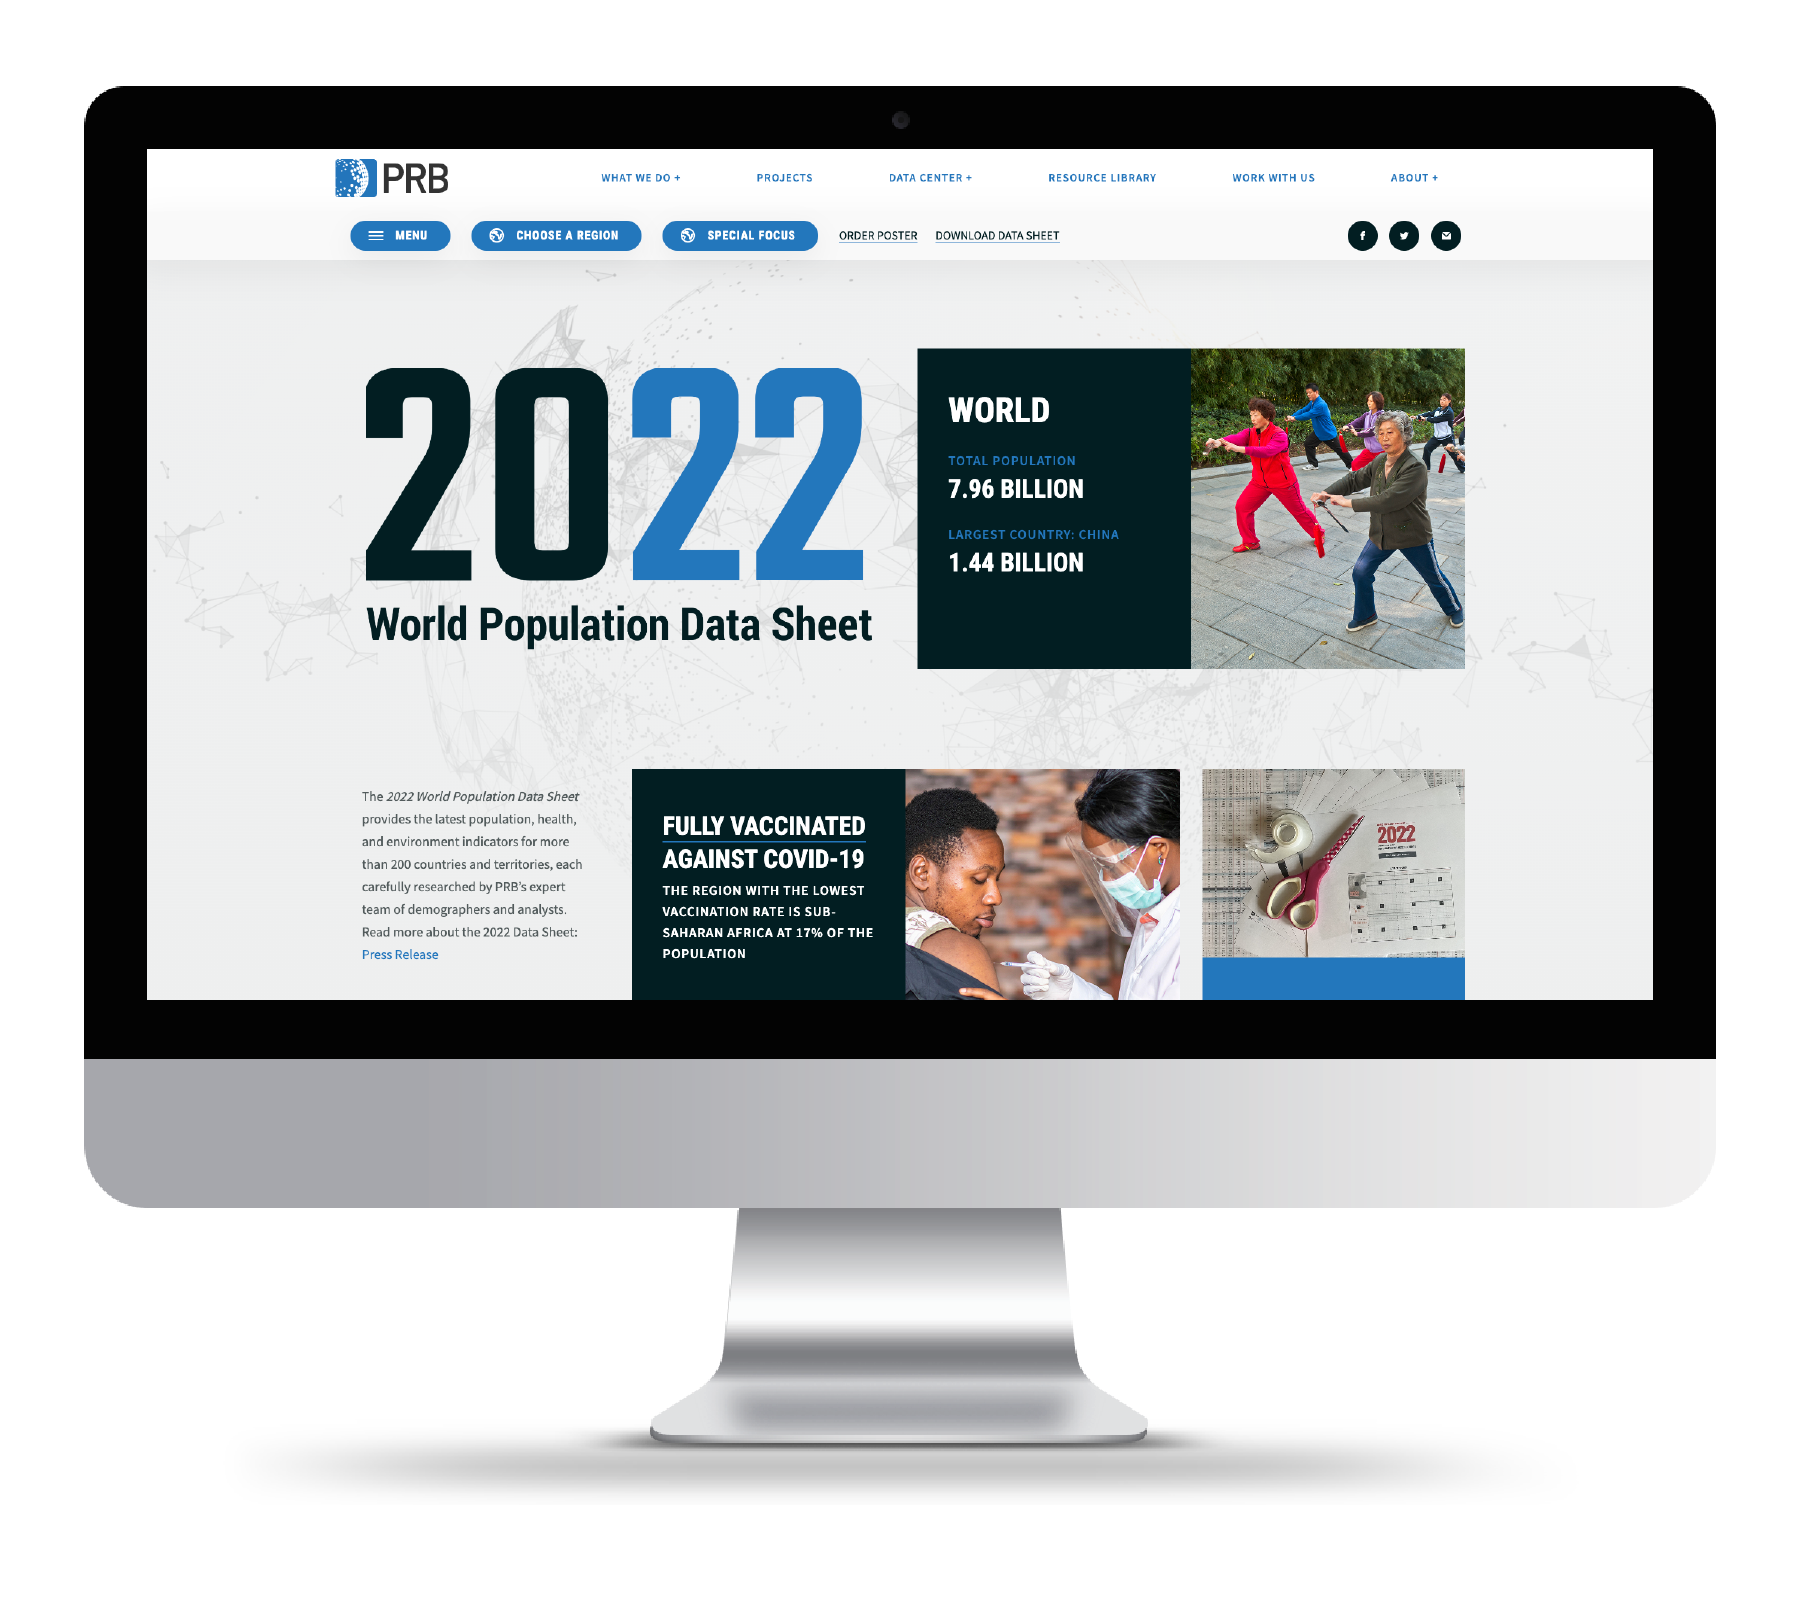
I led production of all pieces of the 2022 World Population Data Sheet including the website update, print poster design, media tip sheets, social, and more.
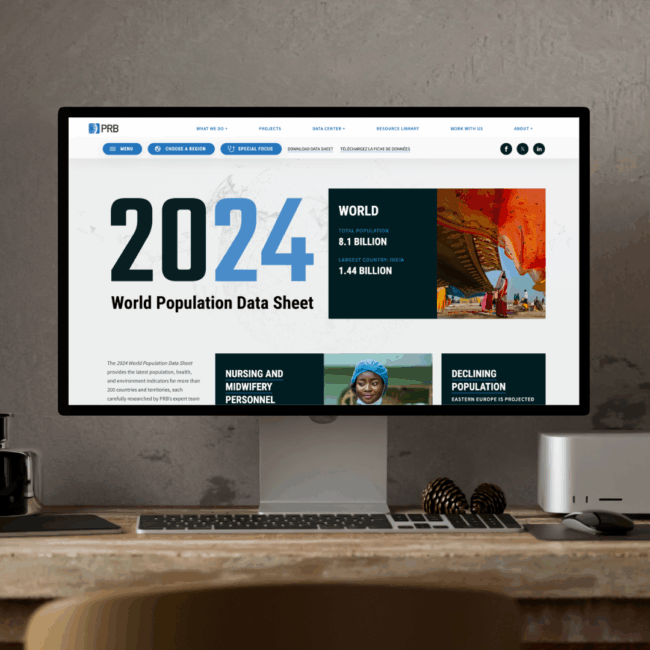
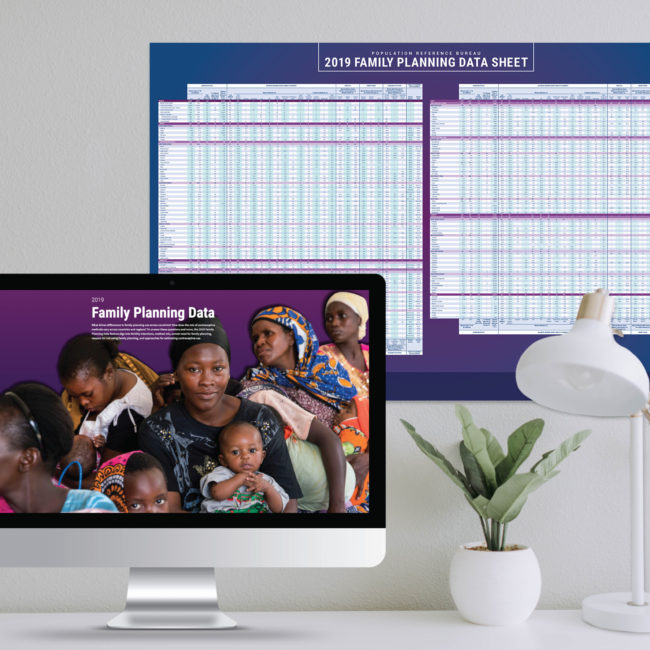
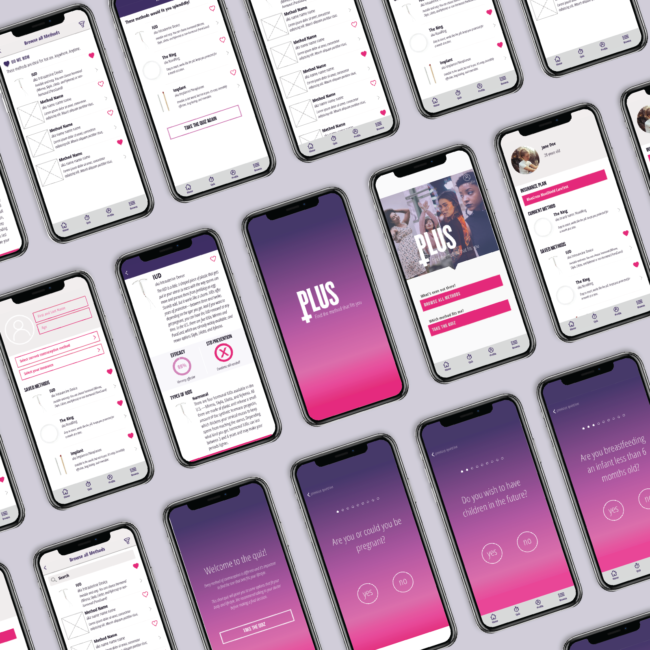
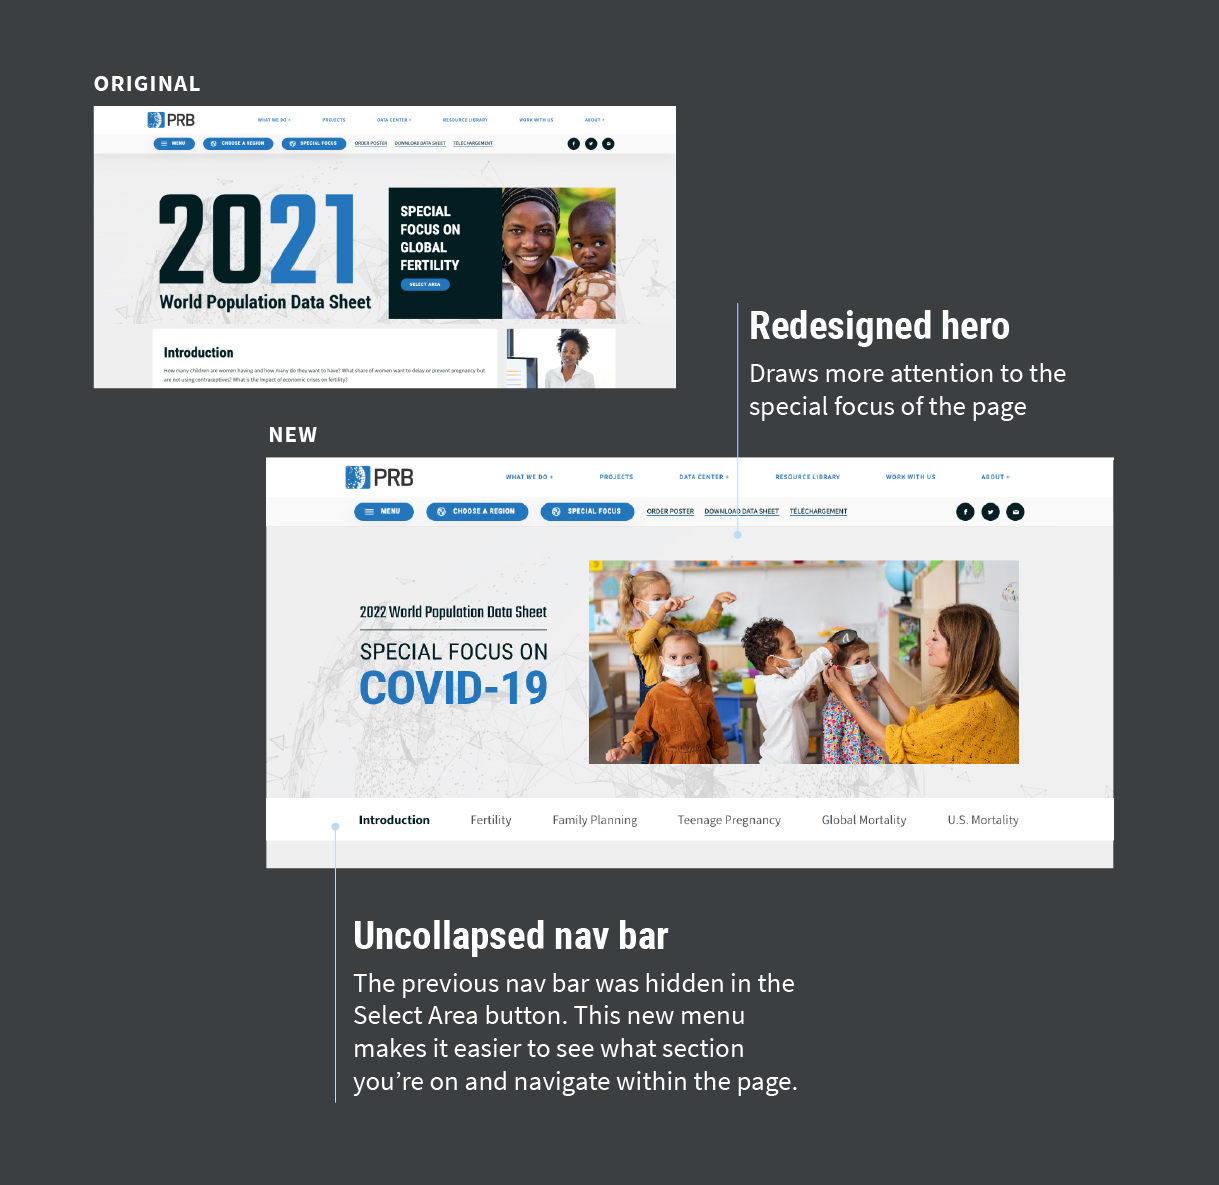
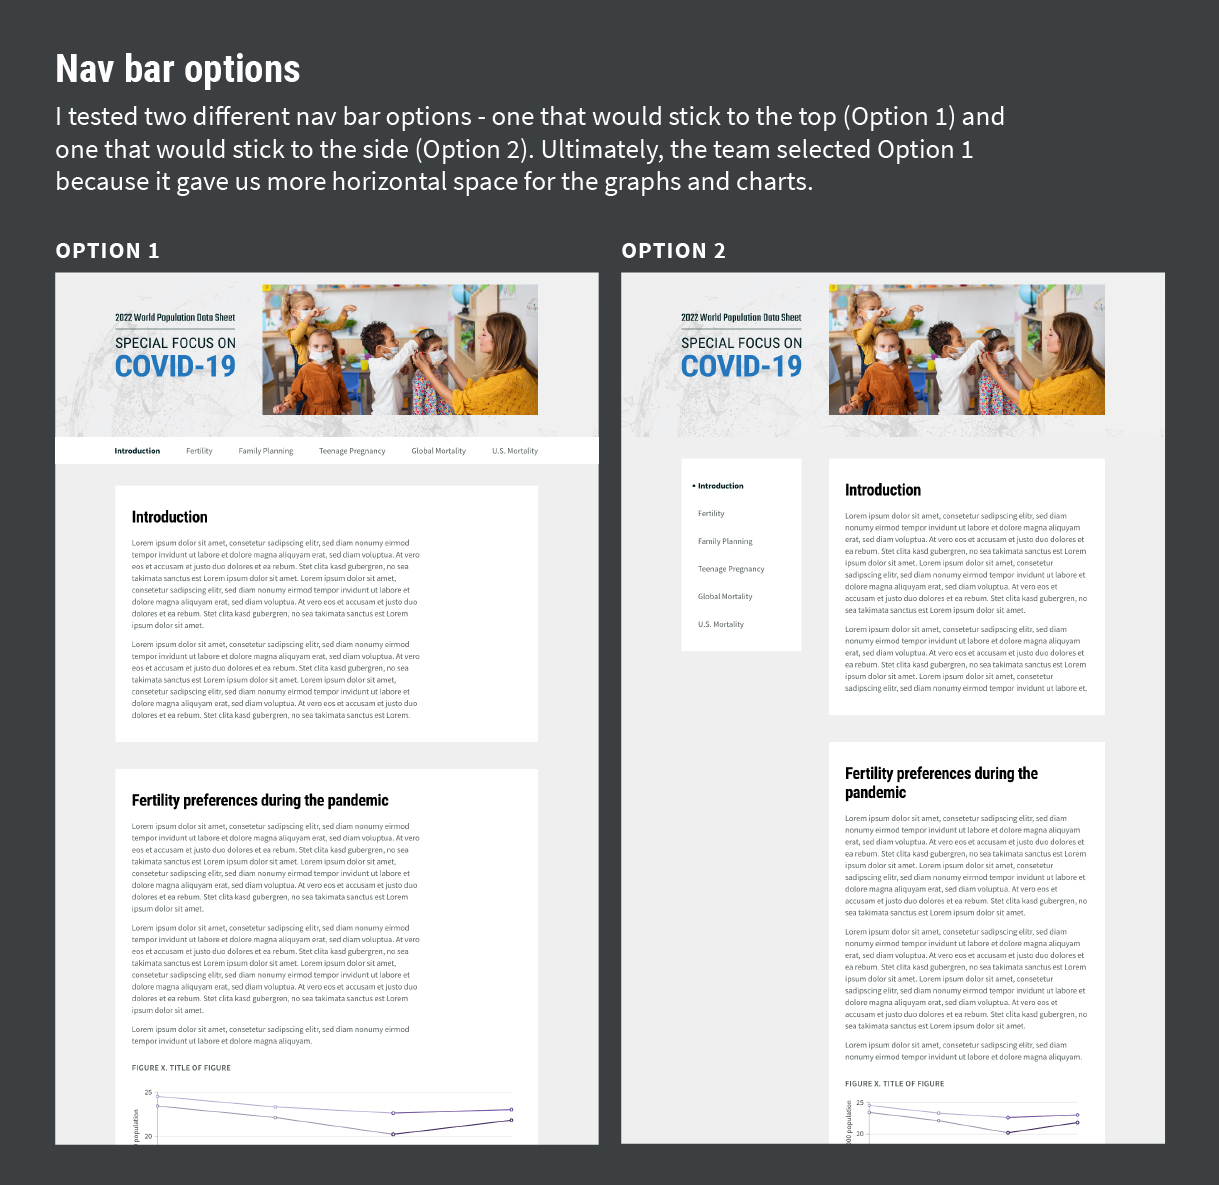
The website had an existing page to feature data on the year’s special focus, but the client and I both felt like it could use a bit of a face lift. While we didn’t have the time or budget for a full overhaul, I worked in Adobe XD to replicate the existing design and make some subtle but helpful user-friendly modifications. These included:
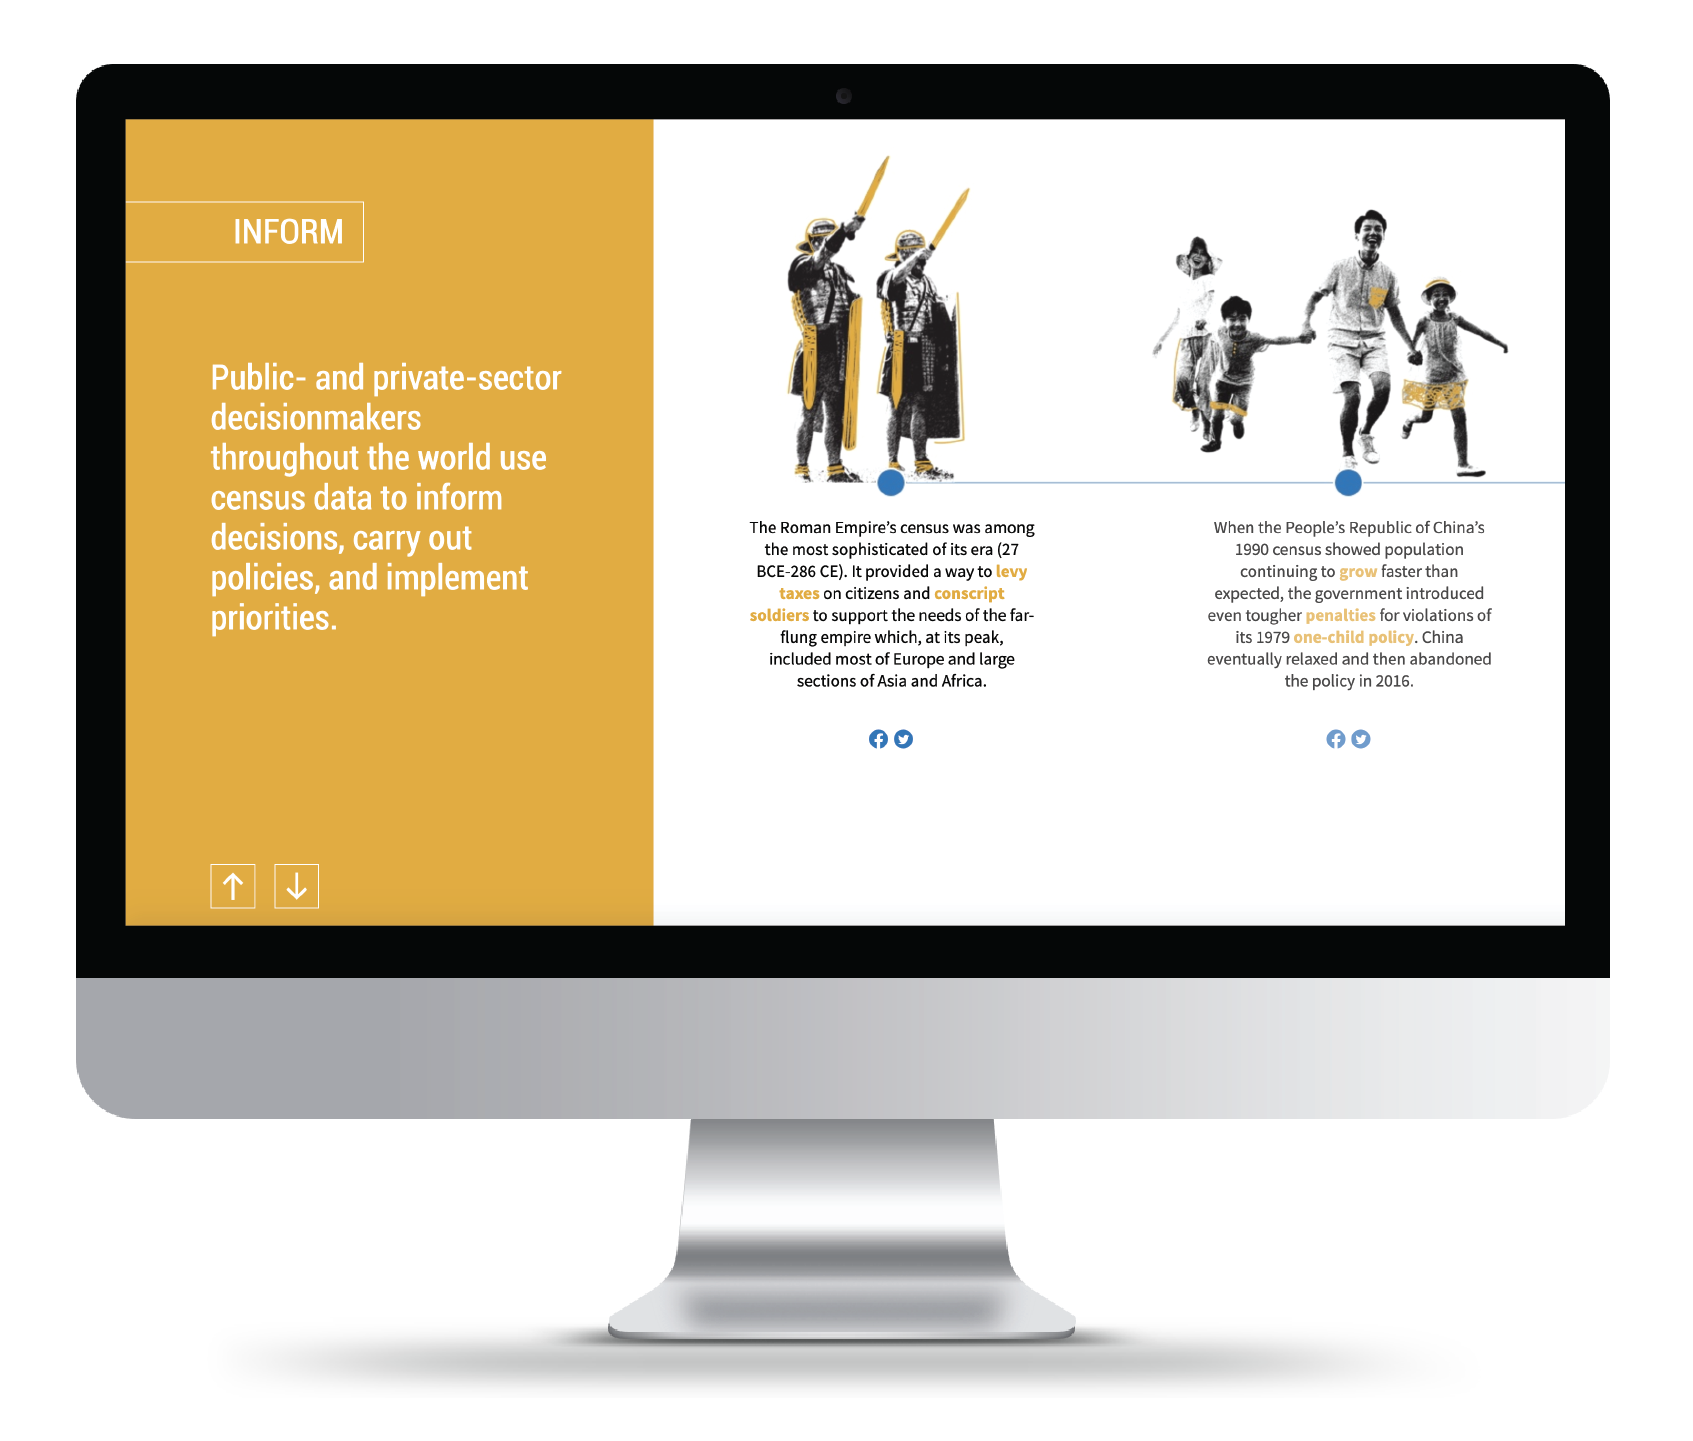
I also worked with the data team to decide on the best data visualization approach for data set and then designed the visuals. I collaborated closely with the developer to ensure proper functionality and execution of the site.
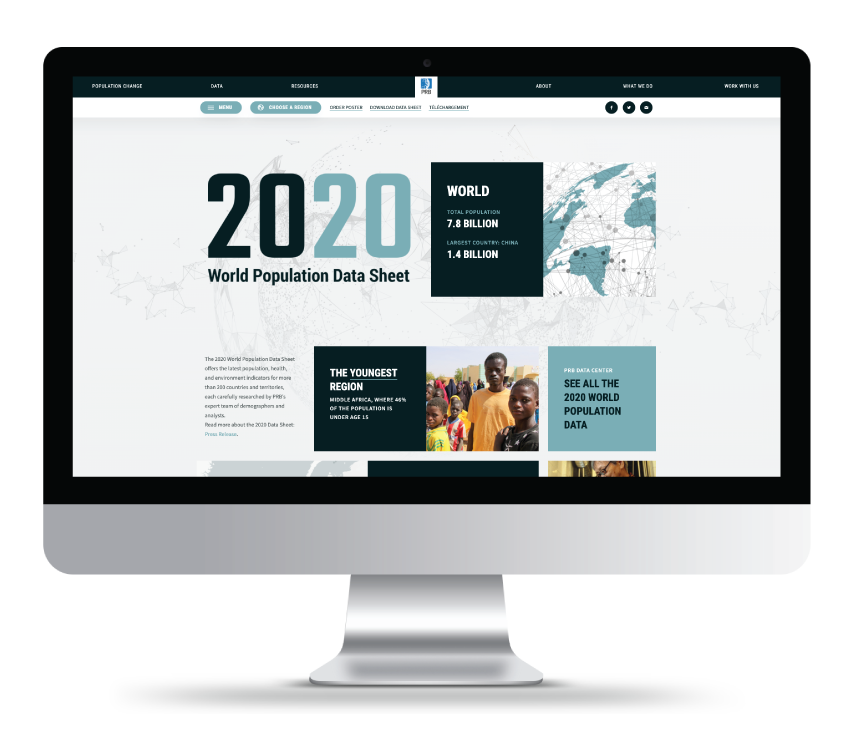
In 2019, we shifted from a print-first approach for the World Population Data Sheet to a digital-first one. PRB’s Creative Director and I have made the design process for both of these pieces collaborative instead of relying upon one to dictate the direction of the other. Through this process, we ensure that the website and poster have a unified, cohesive feel and design.
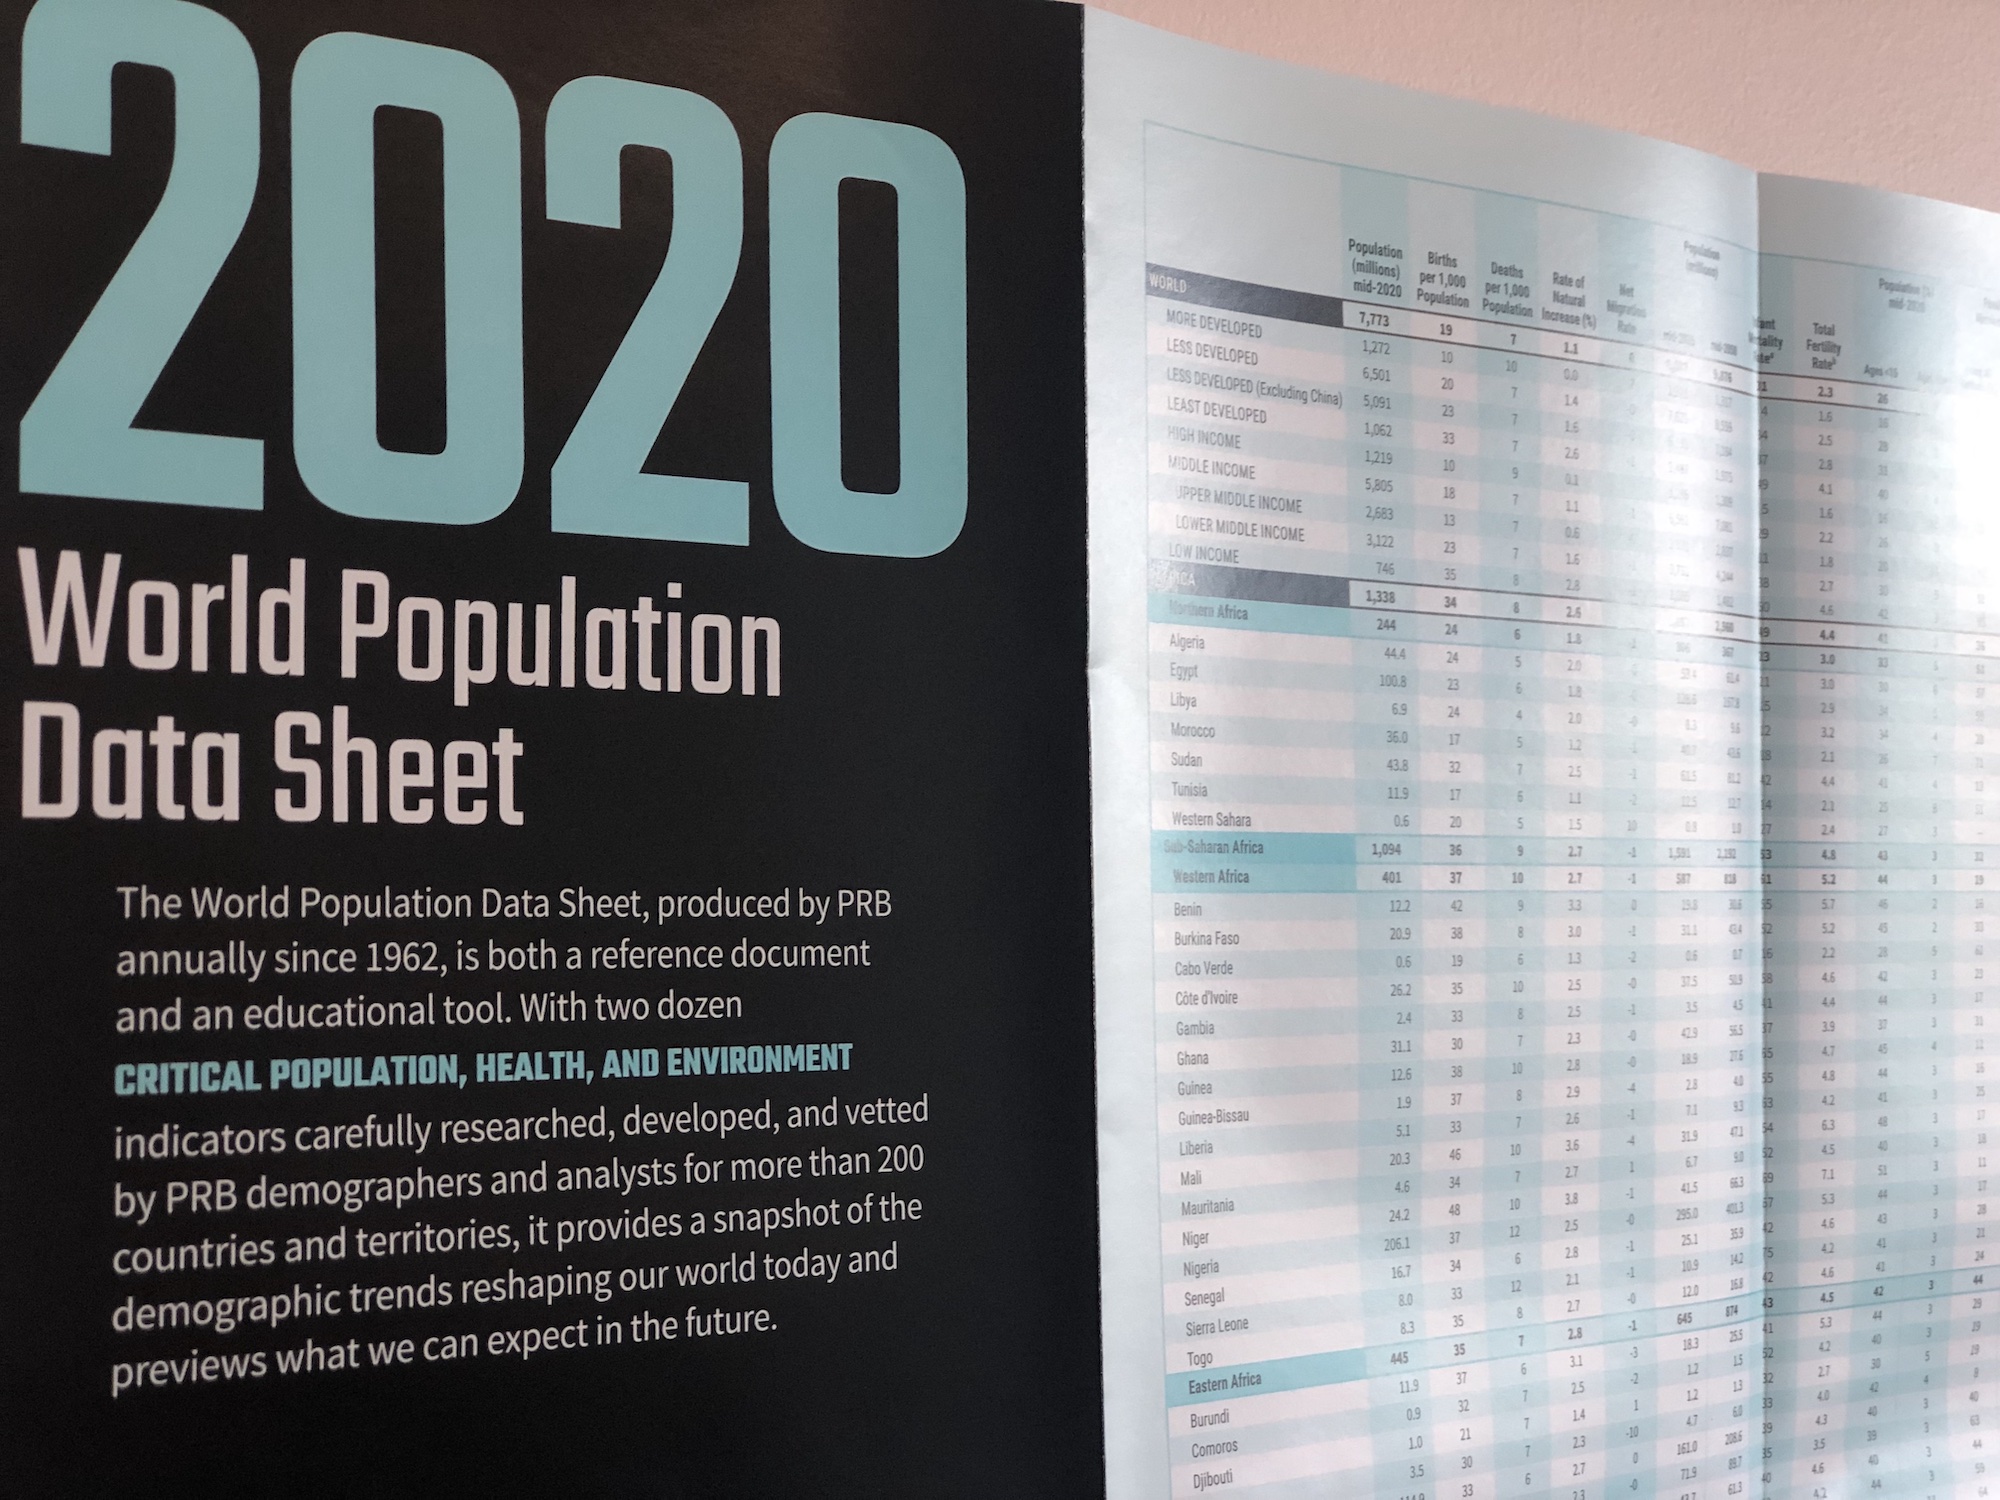
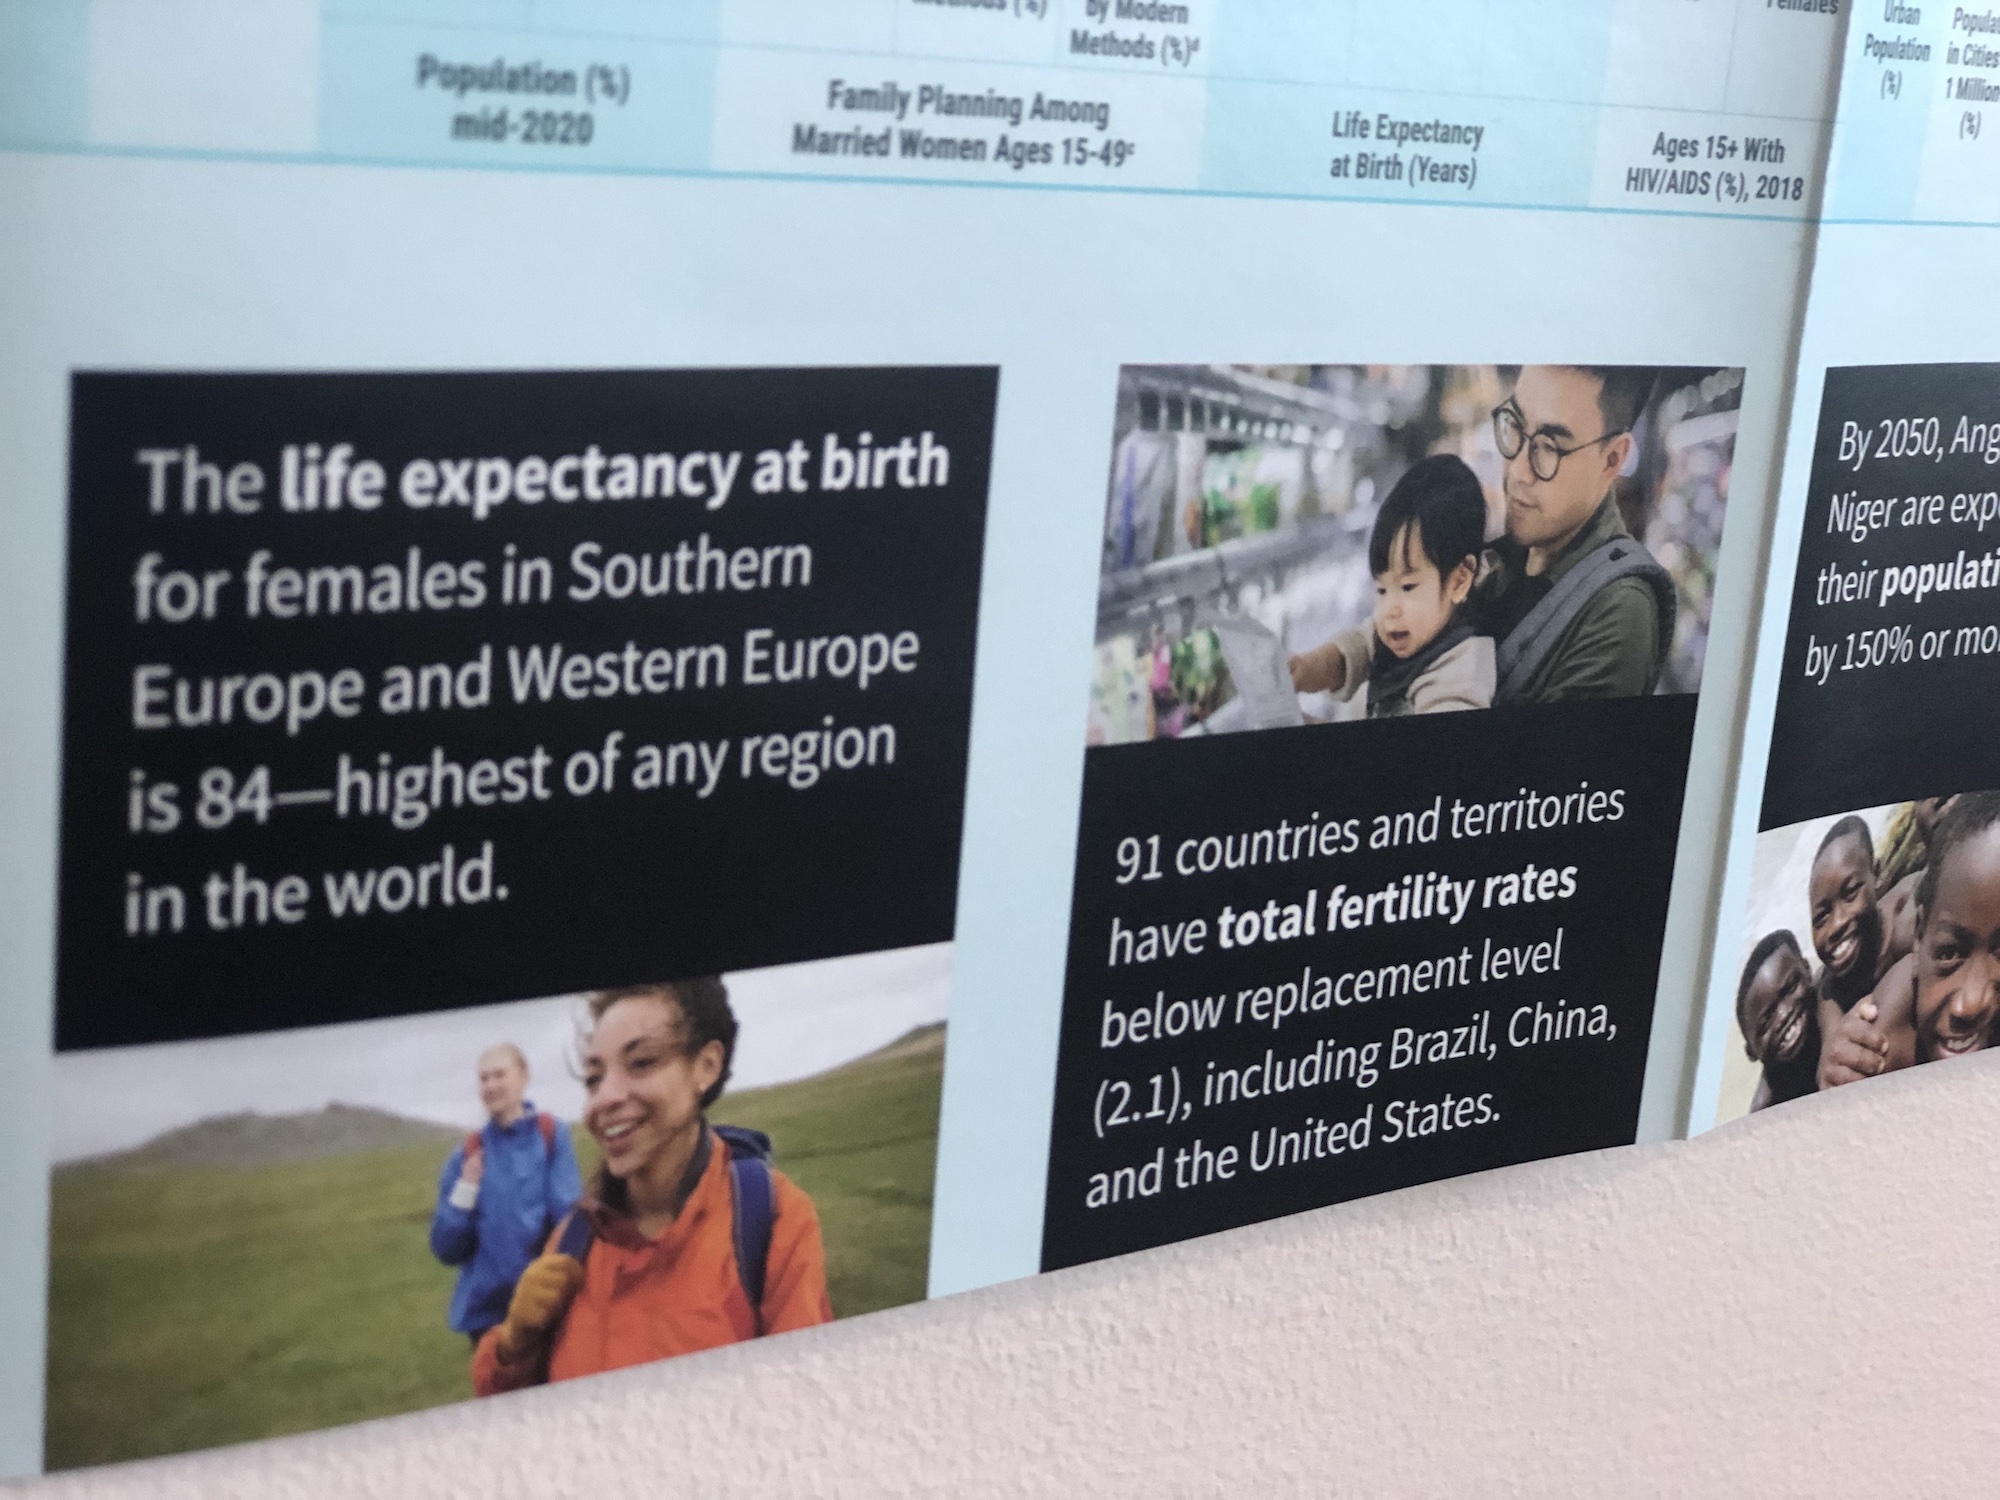
When I designed the 2019 World Pop Data Sheet poster, I created a series of paragraph styles in InDesign for the meticulous data entry component of the poster design. PRB’s editorial style aligns all numbers to the decimal, meaning I needed to ensure every data point was set to the correct style to align. Creating the paragraph styles system has saved hours of labor and has allowed us to spend more time focusing on the design of the poster and the accompanying website.