Lorem ipsum dolor amet, consect adipiscing elit, diam nonummy.

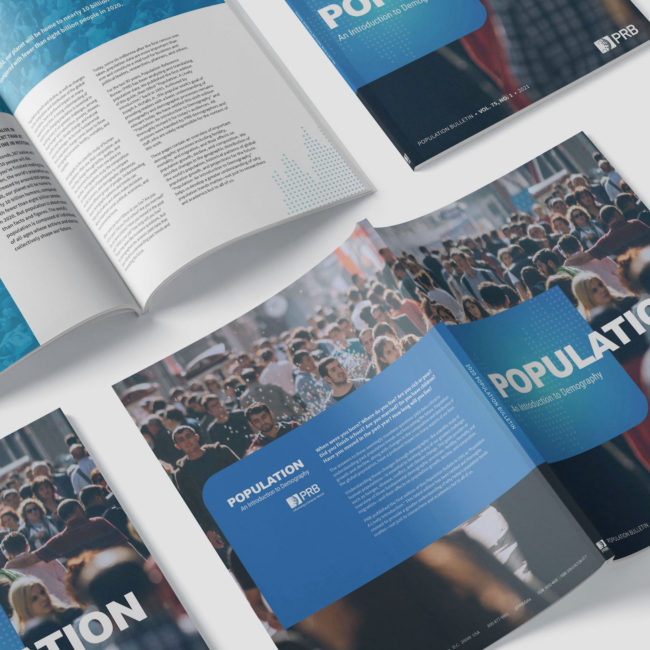
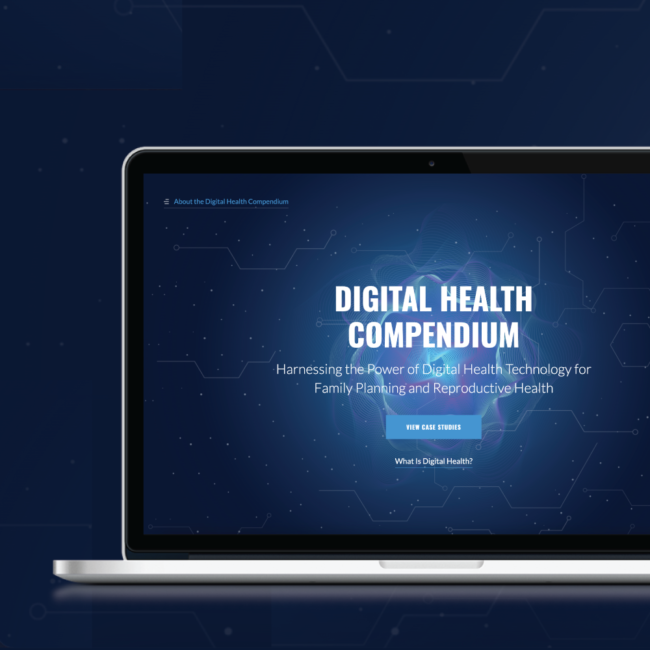
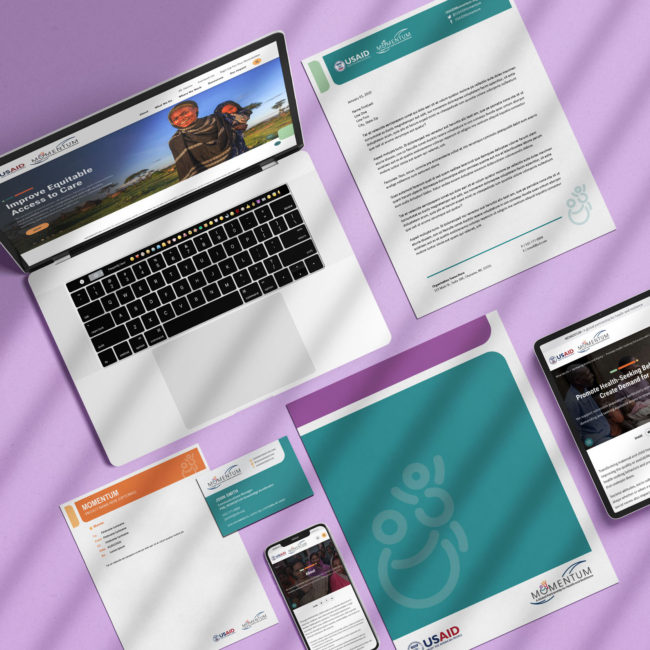
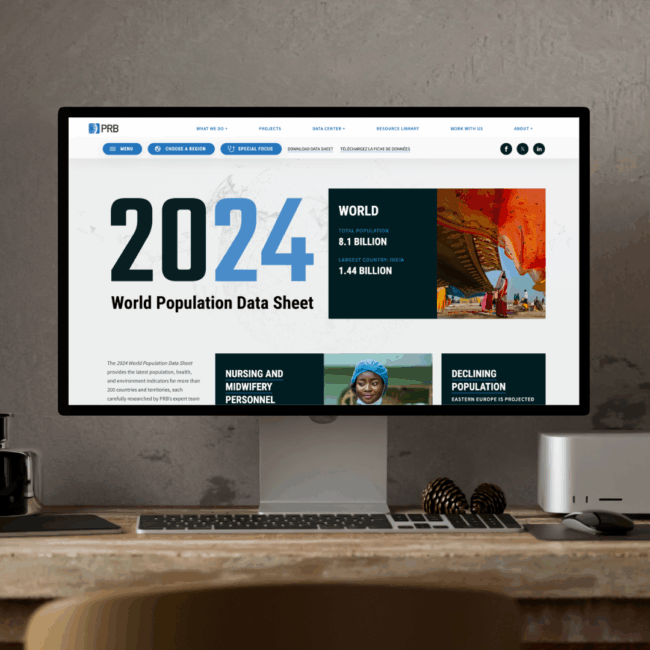
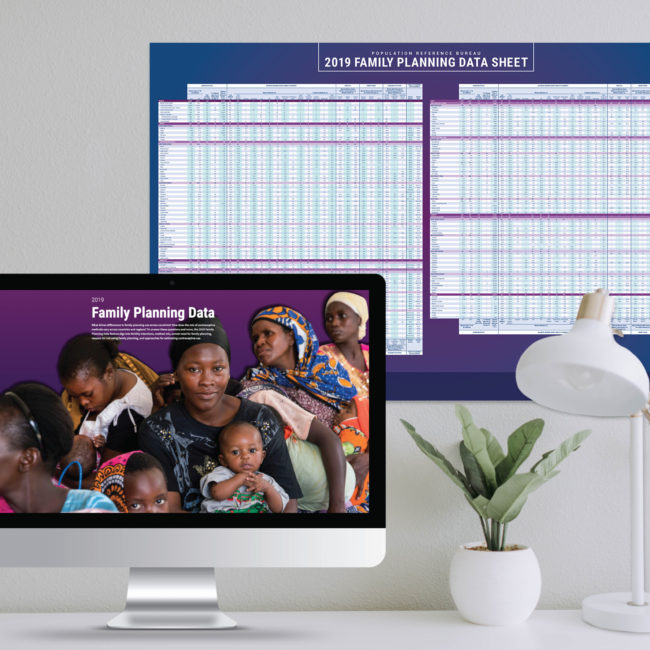
The Family Planning Review is a historically printed report, updated every 10 years with up-to-date family planning data from around the world. This year, we were selected to create the first-ever Family Planning Review website.
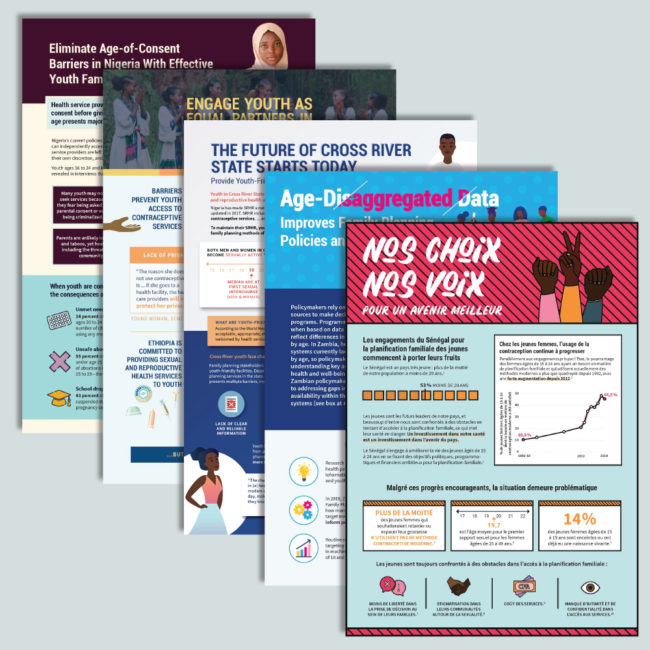
I wore a jill-of-all-trades cap for this project as I led our internal project management, designed low-fidelity wireframes, provided high-fidelity design direction, and led the data visualization thinking for all charts and graphics. I ultimately carried the site to completion which involved meticulous oversight of an internationally-based development team, final updates to the backend after publication, and launching a French version of the site.

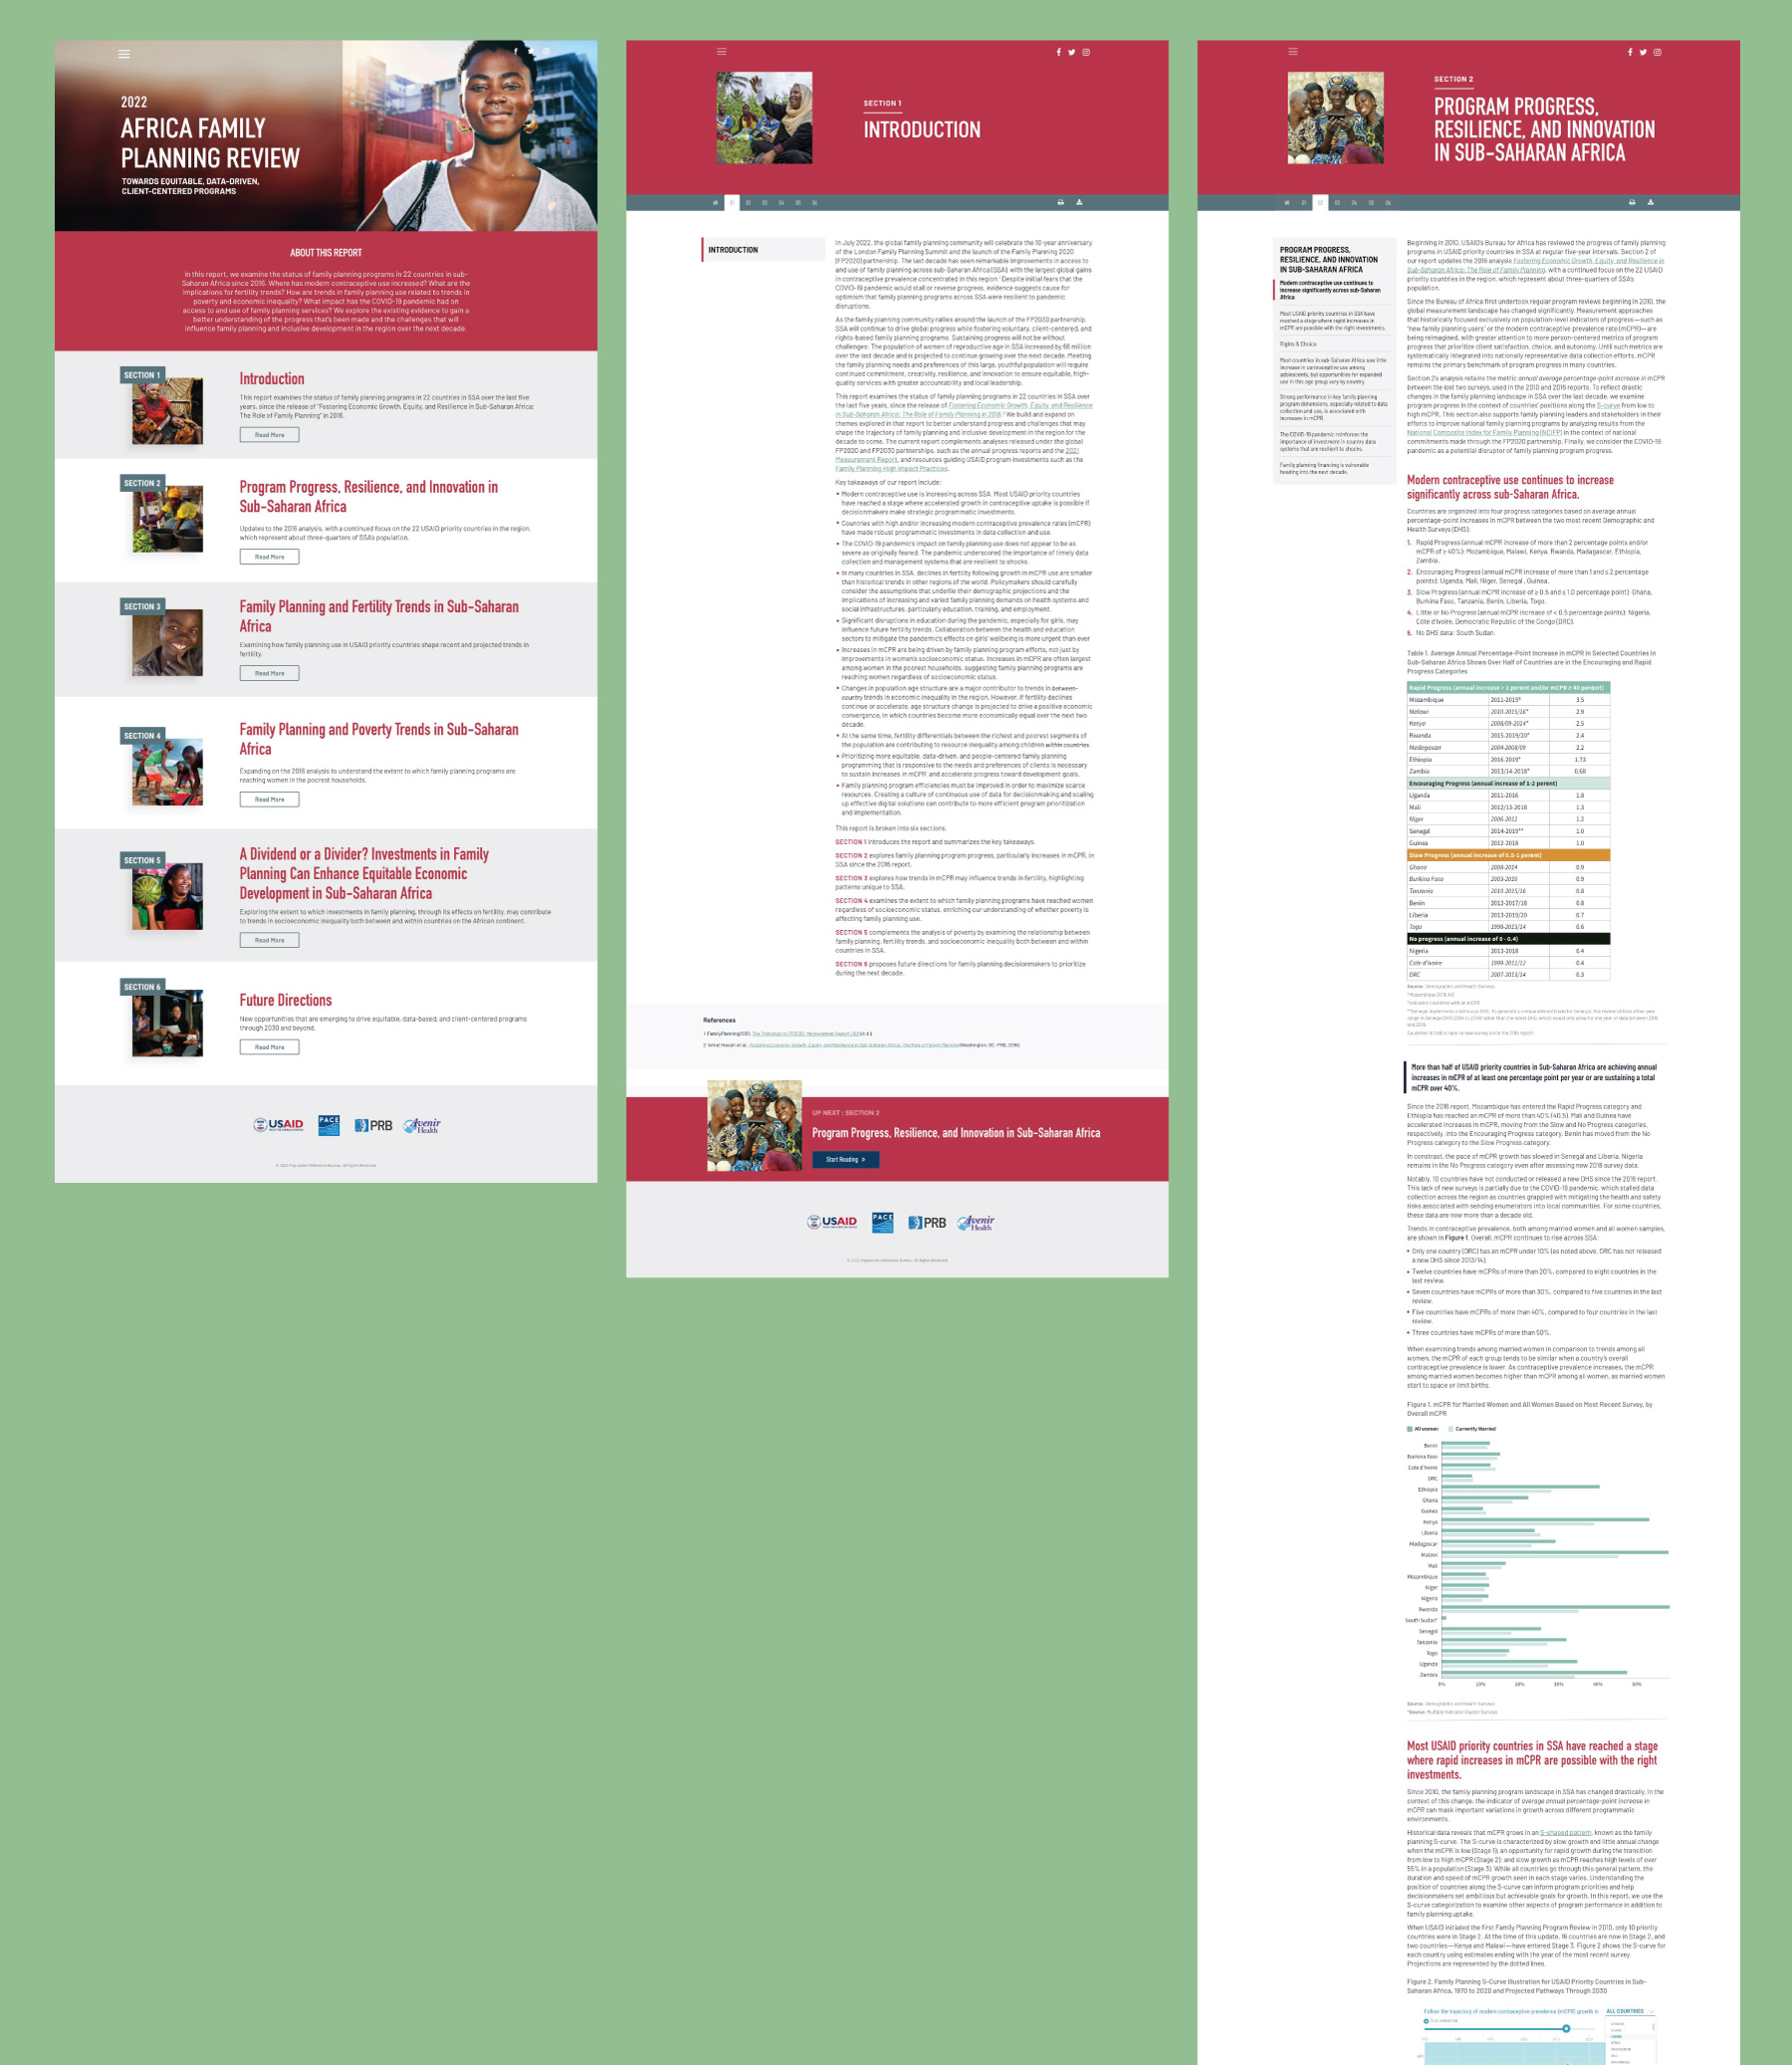
The challenge for this site was coming up with a creative, user-friendly way to display what had historically been a 50-page document.
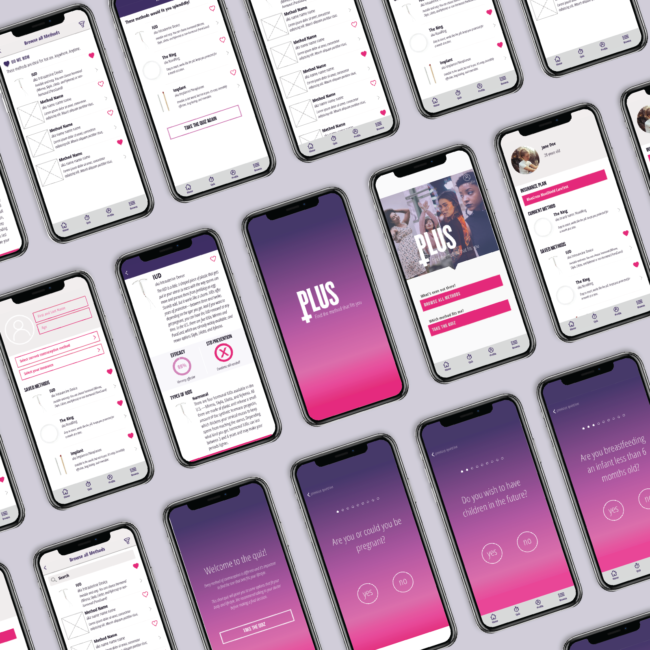
The low-fidelity wireframes I designed took the large draft narrative and sample data sets from the client and divided the content up into six sections. Each section has multiple navigation bars so that a user could easily navigate both within a section and to and from other sections.
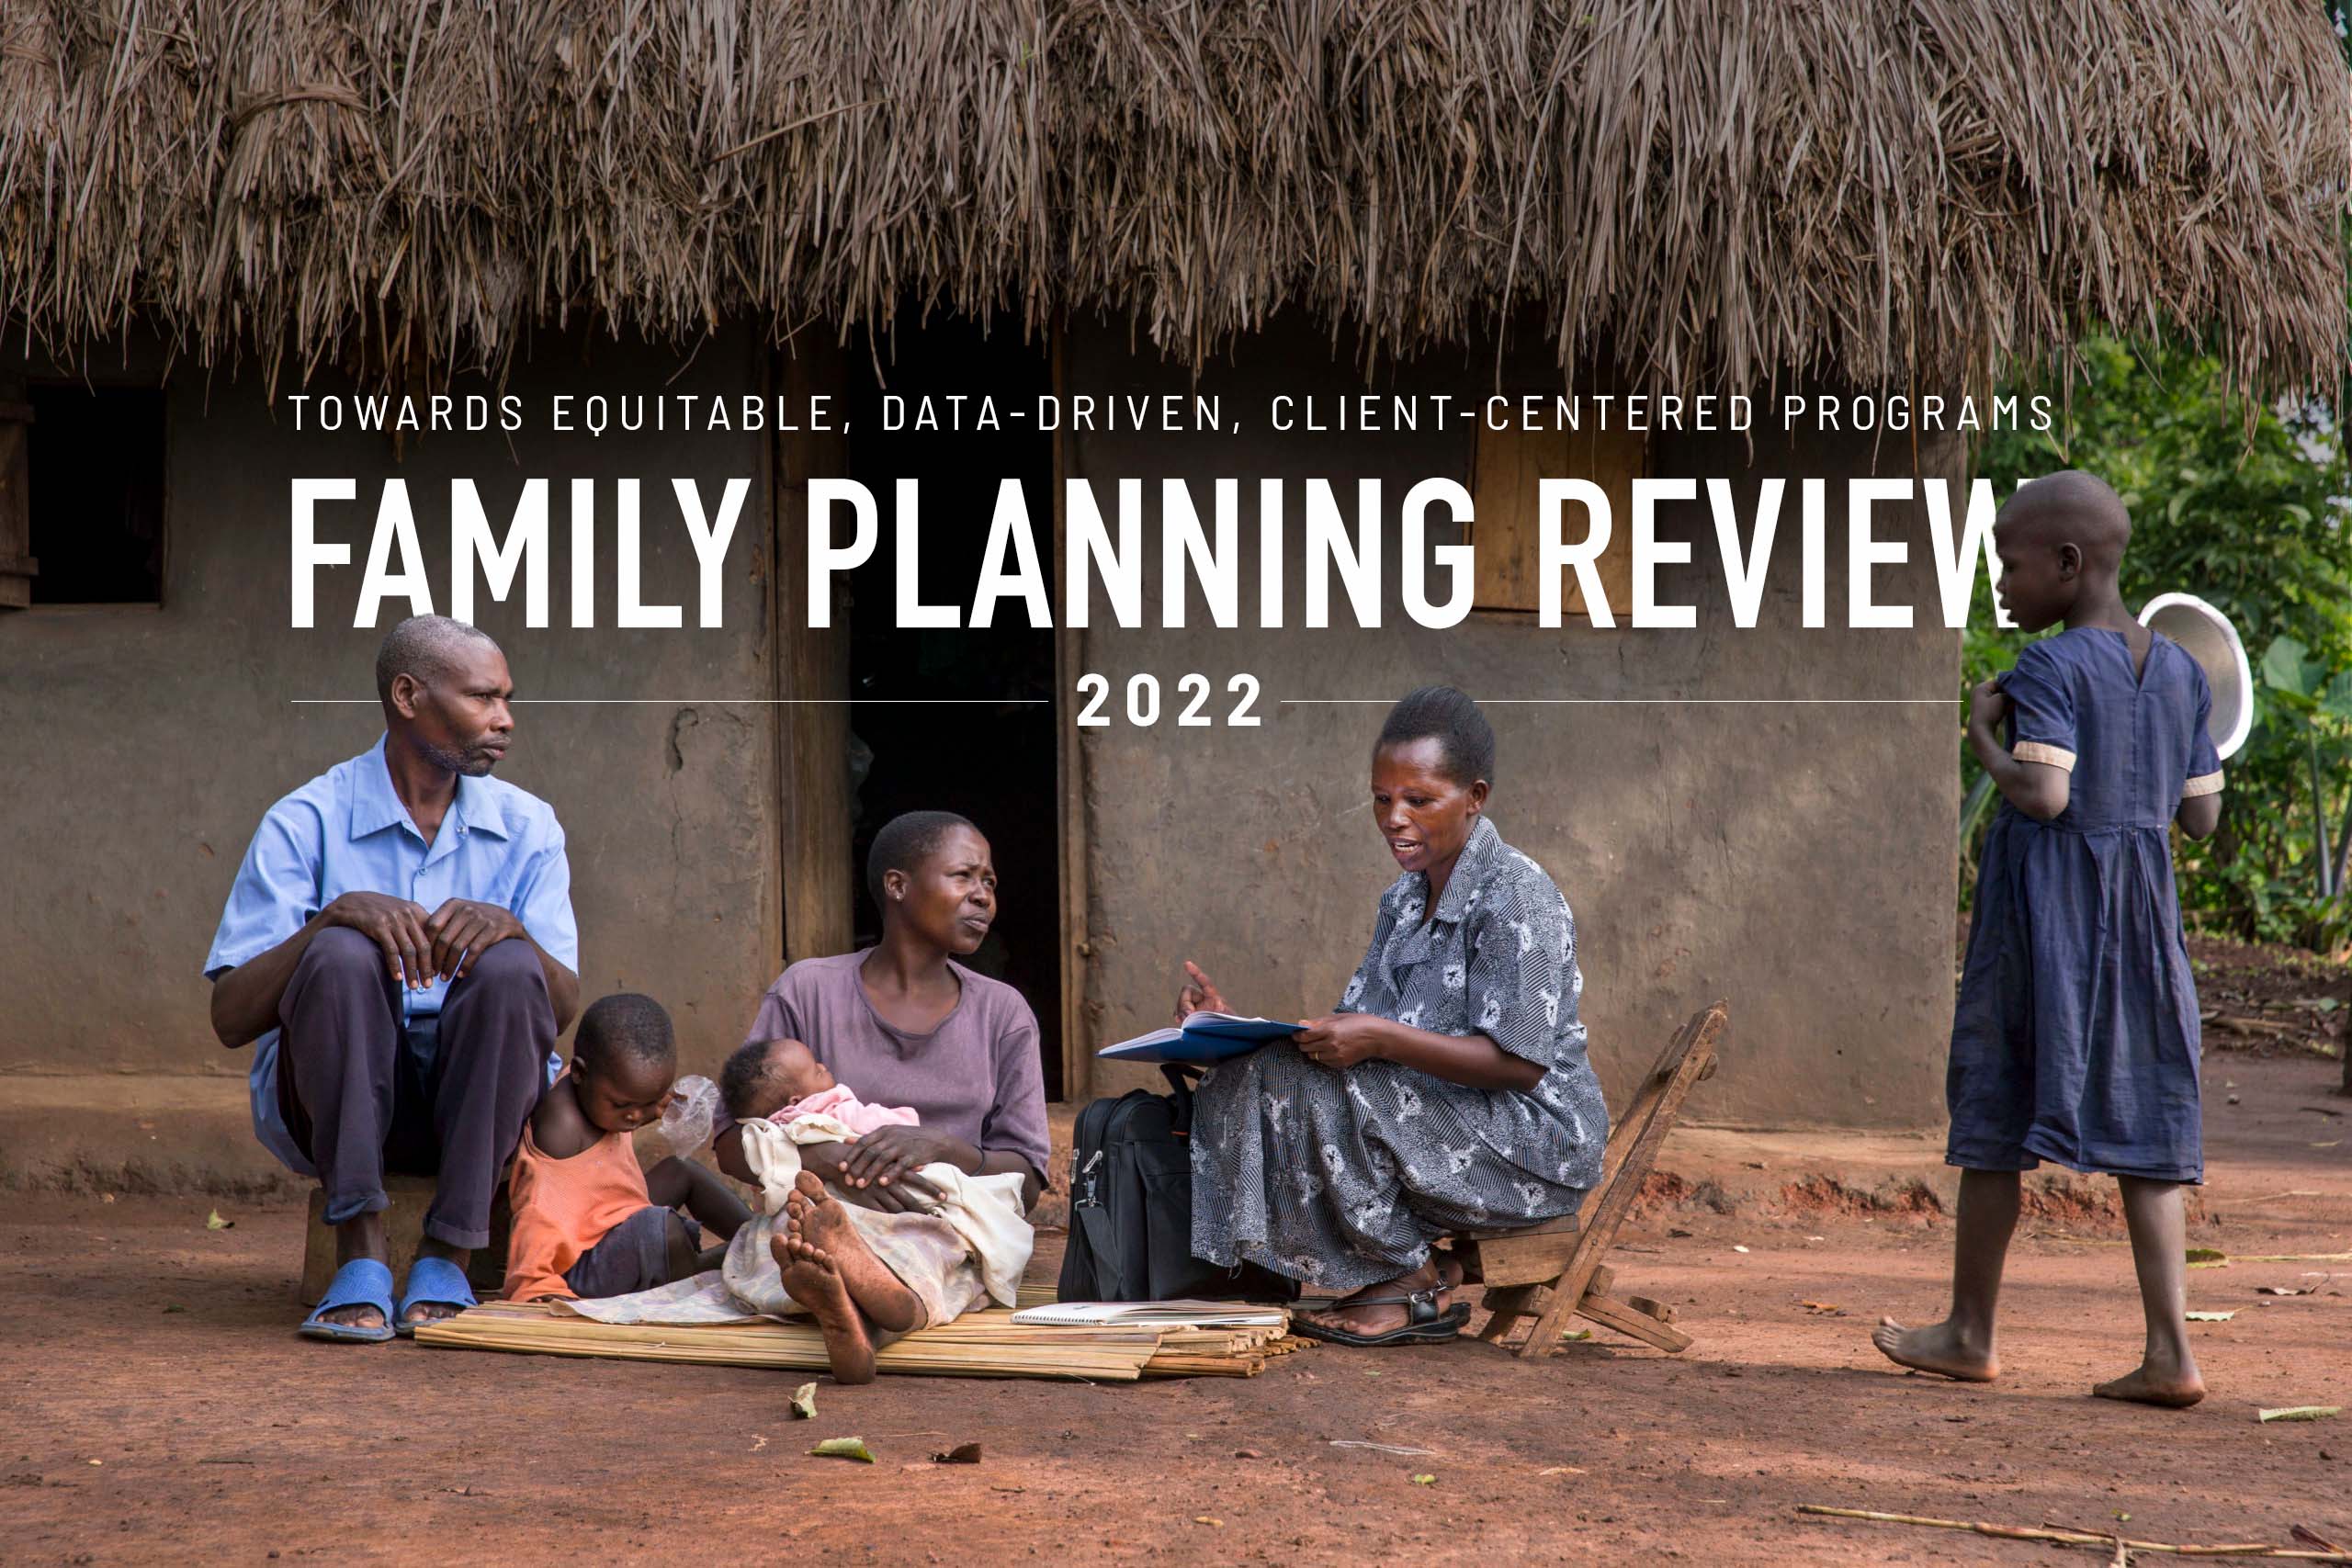
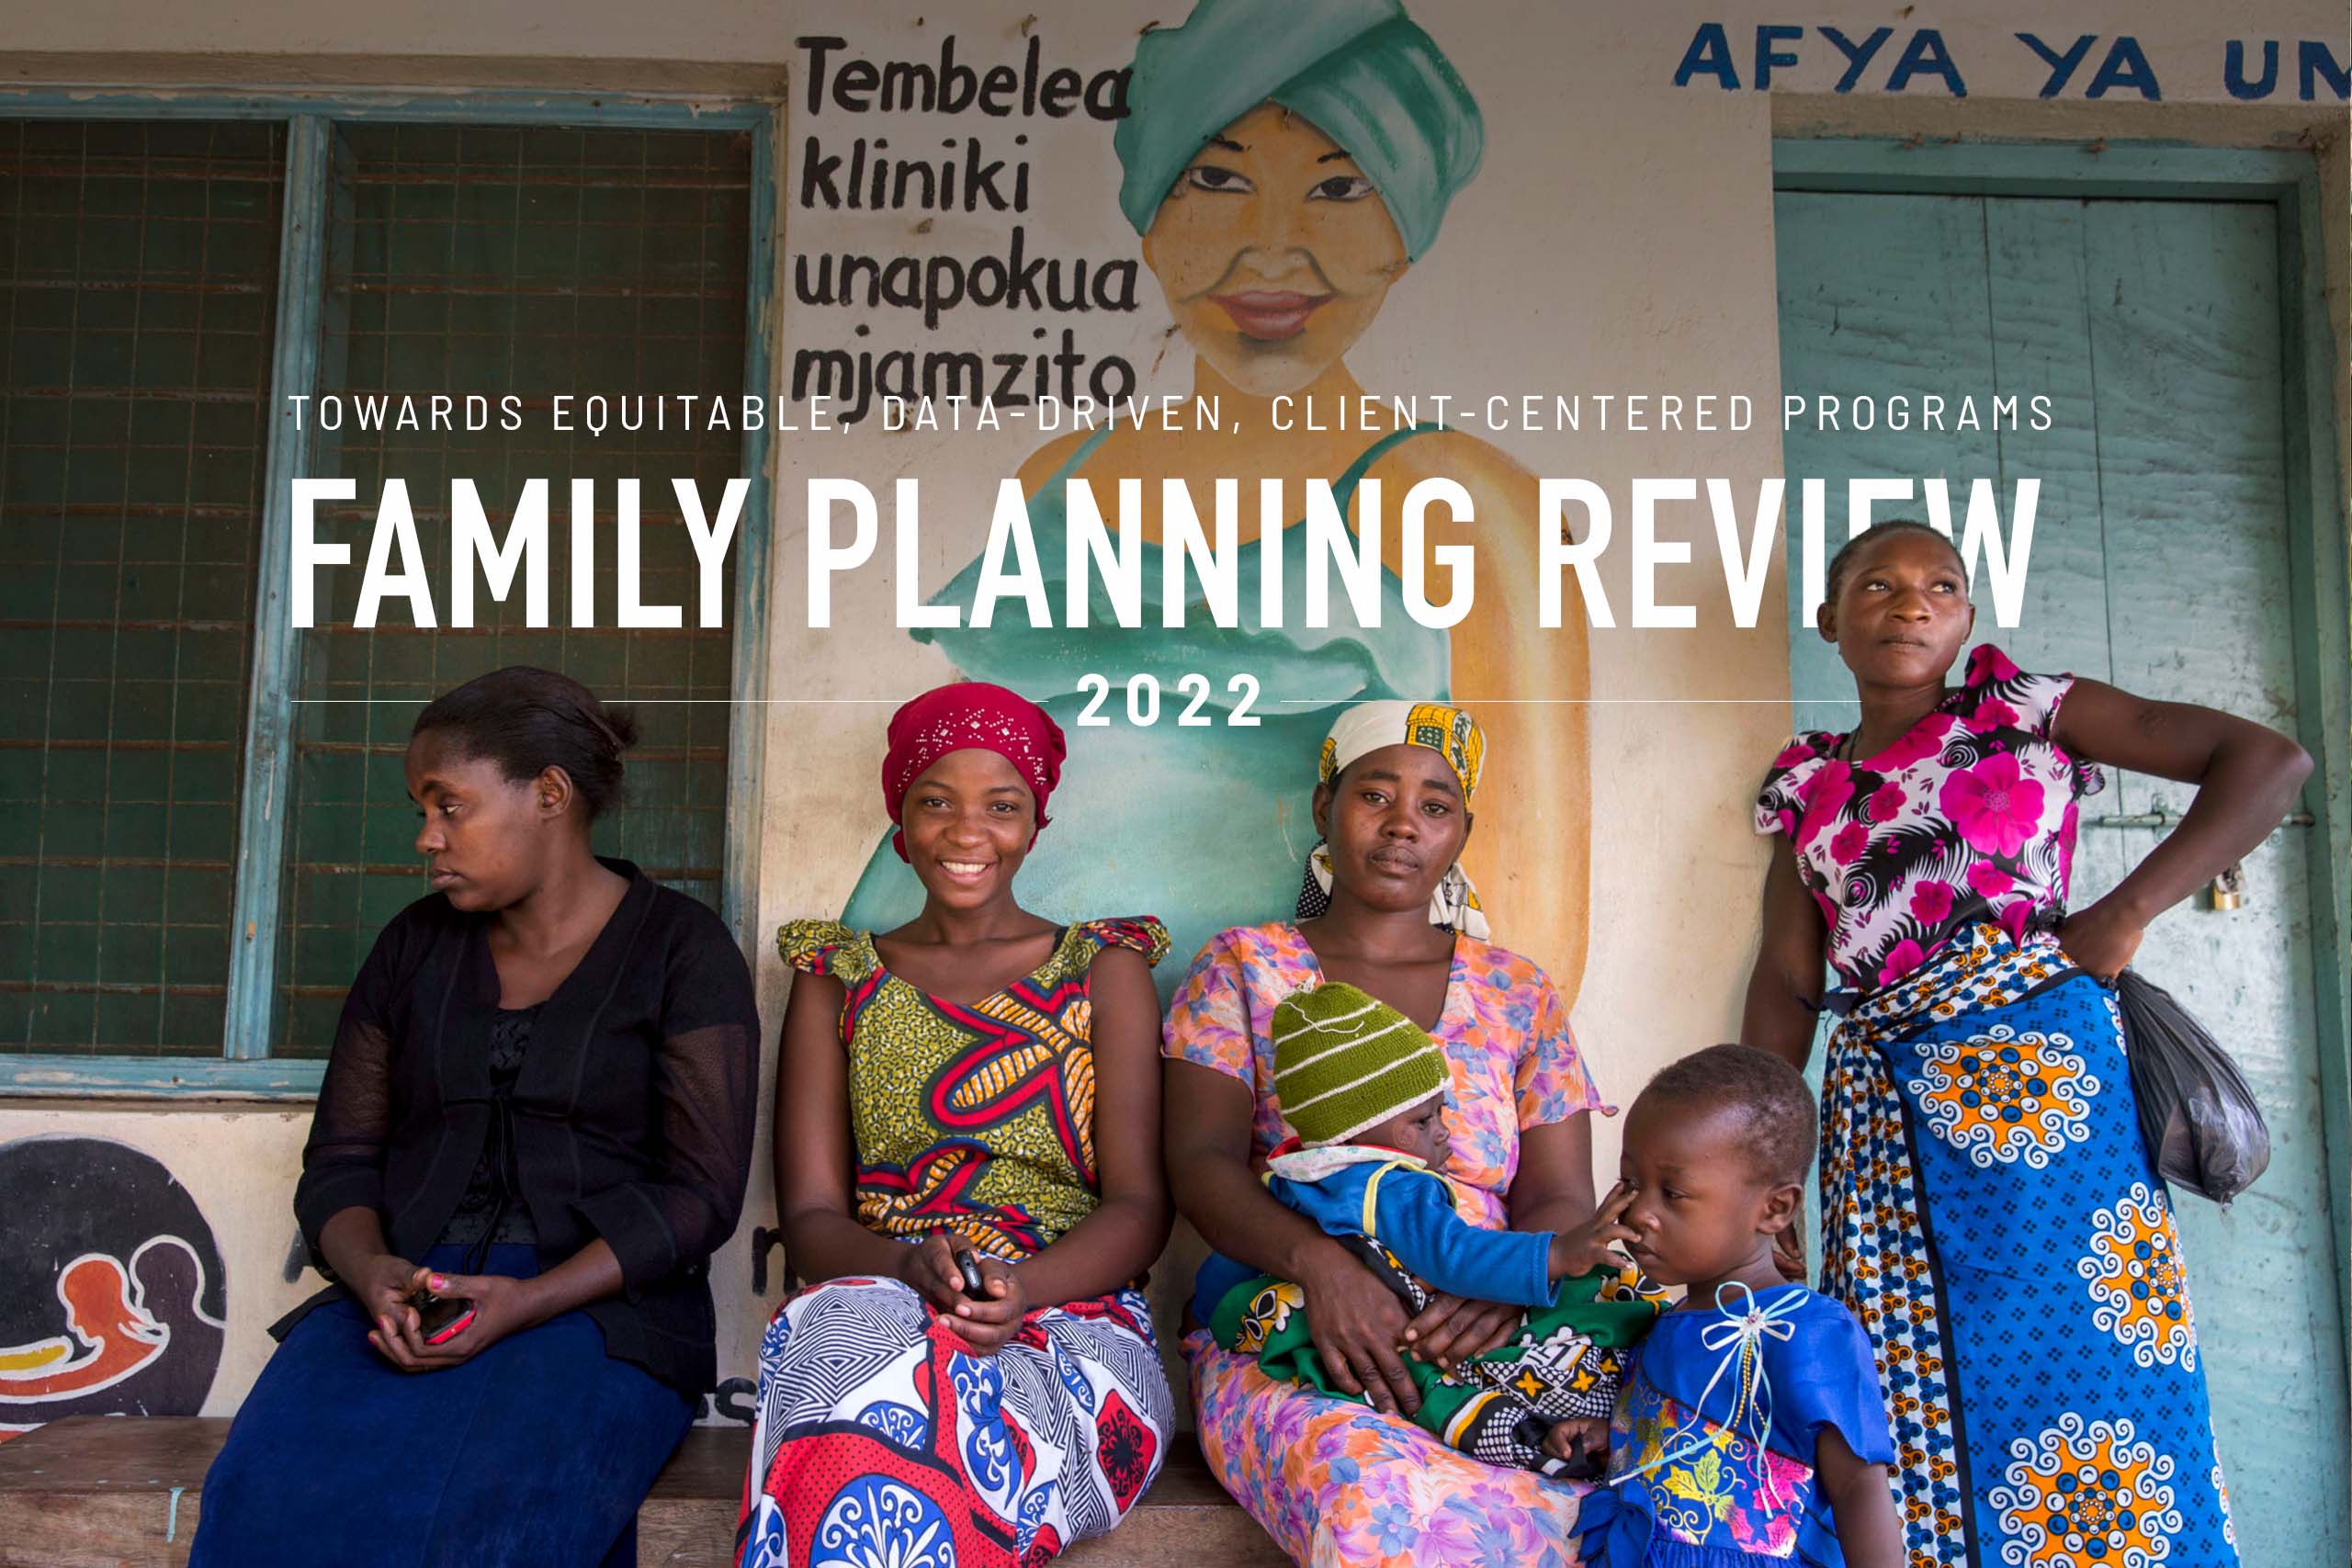
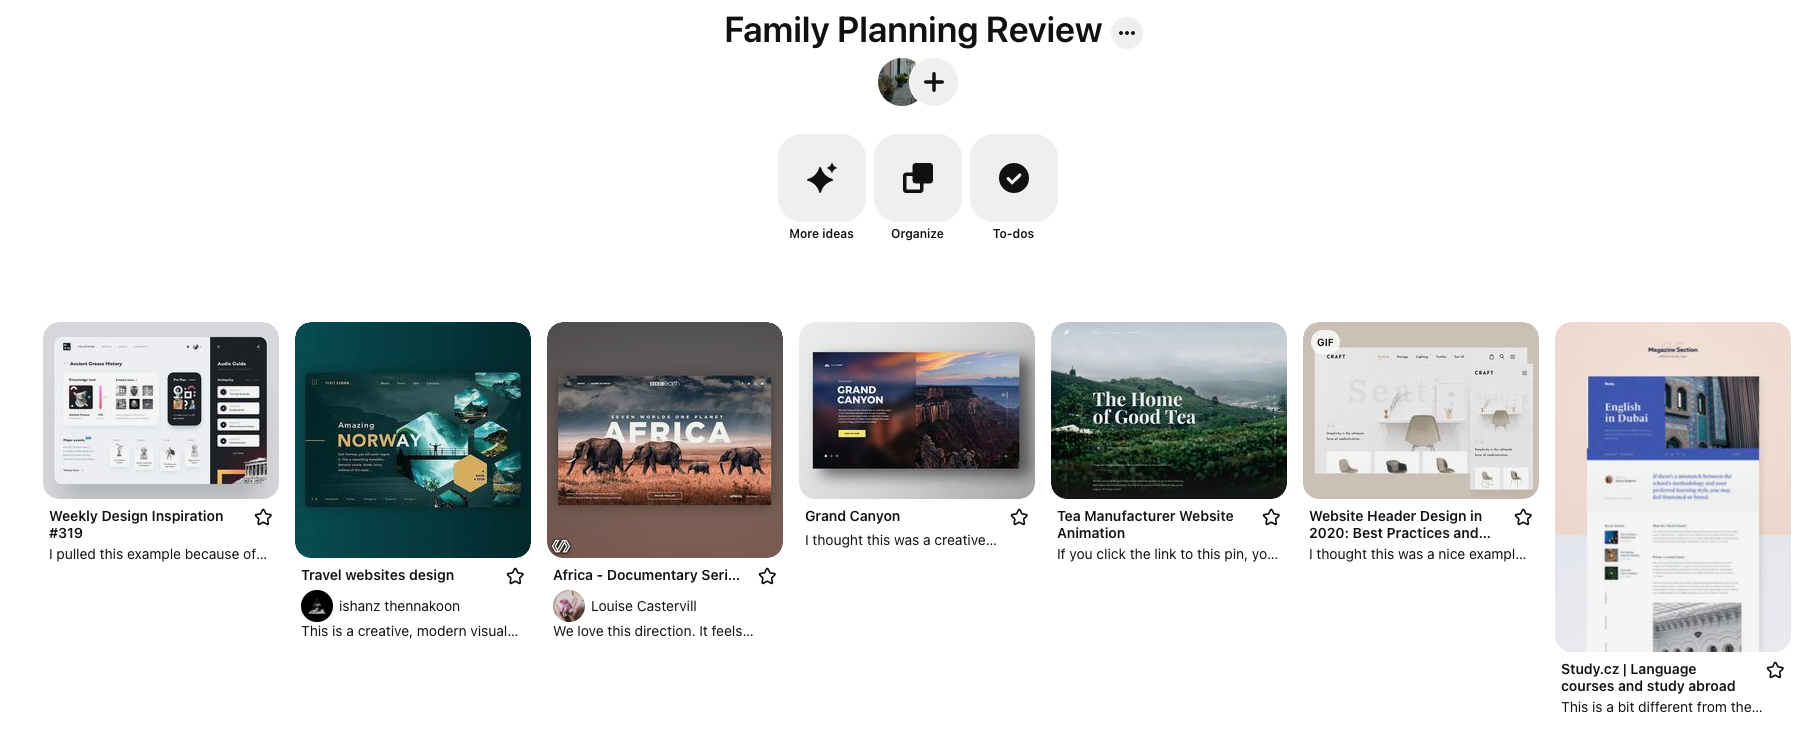
I provided some high-level design concepts to the agency we hired to develop the site. These included a couple hero images I mocked up along with design inspo from Pinterest and Dribbble that was first shared with the client for feedback and then delivered to the agency.
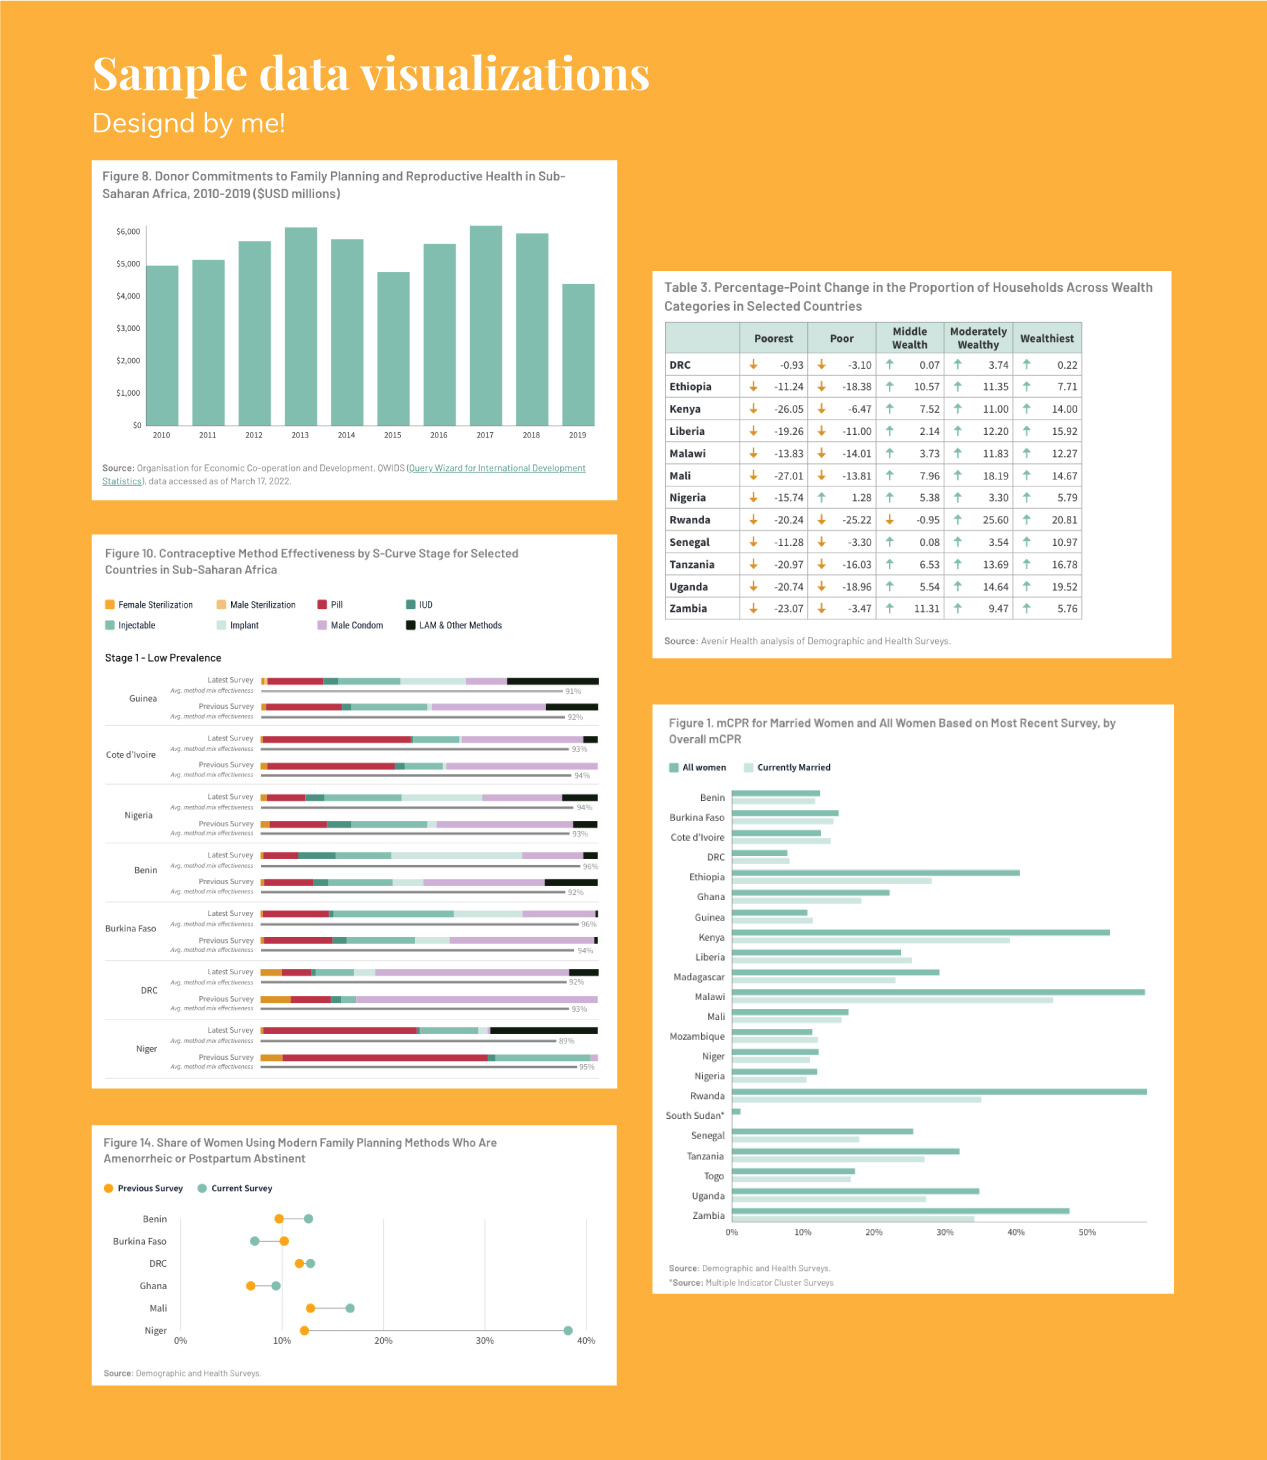
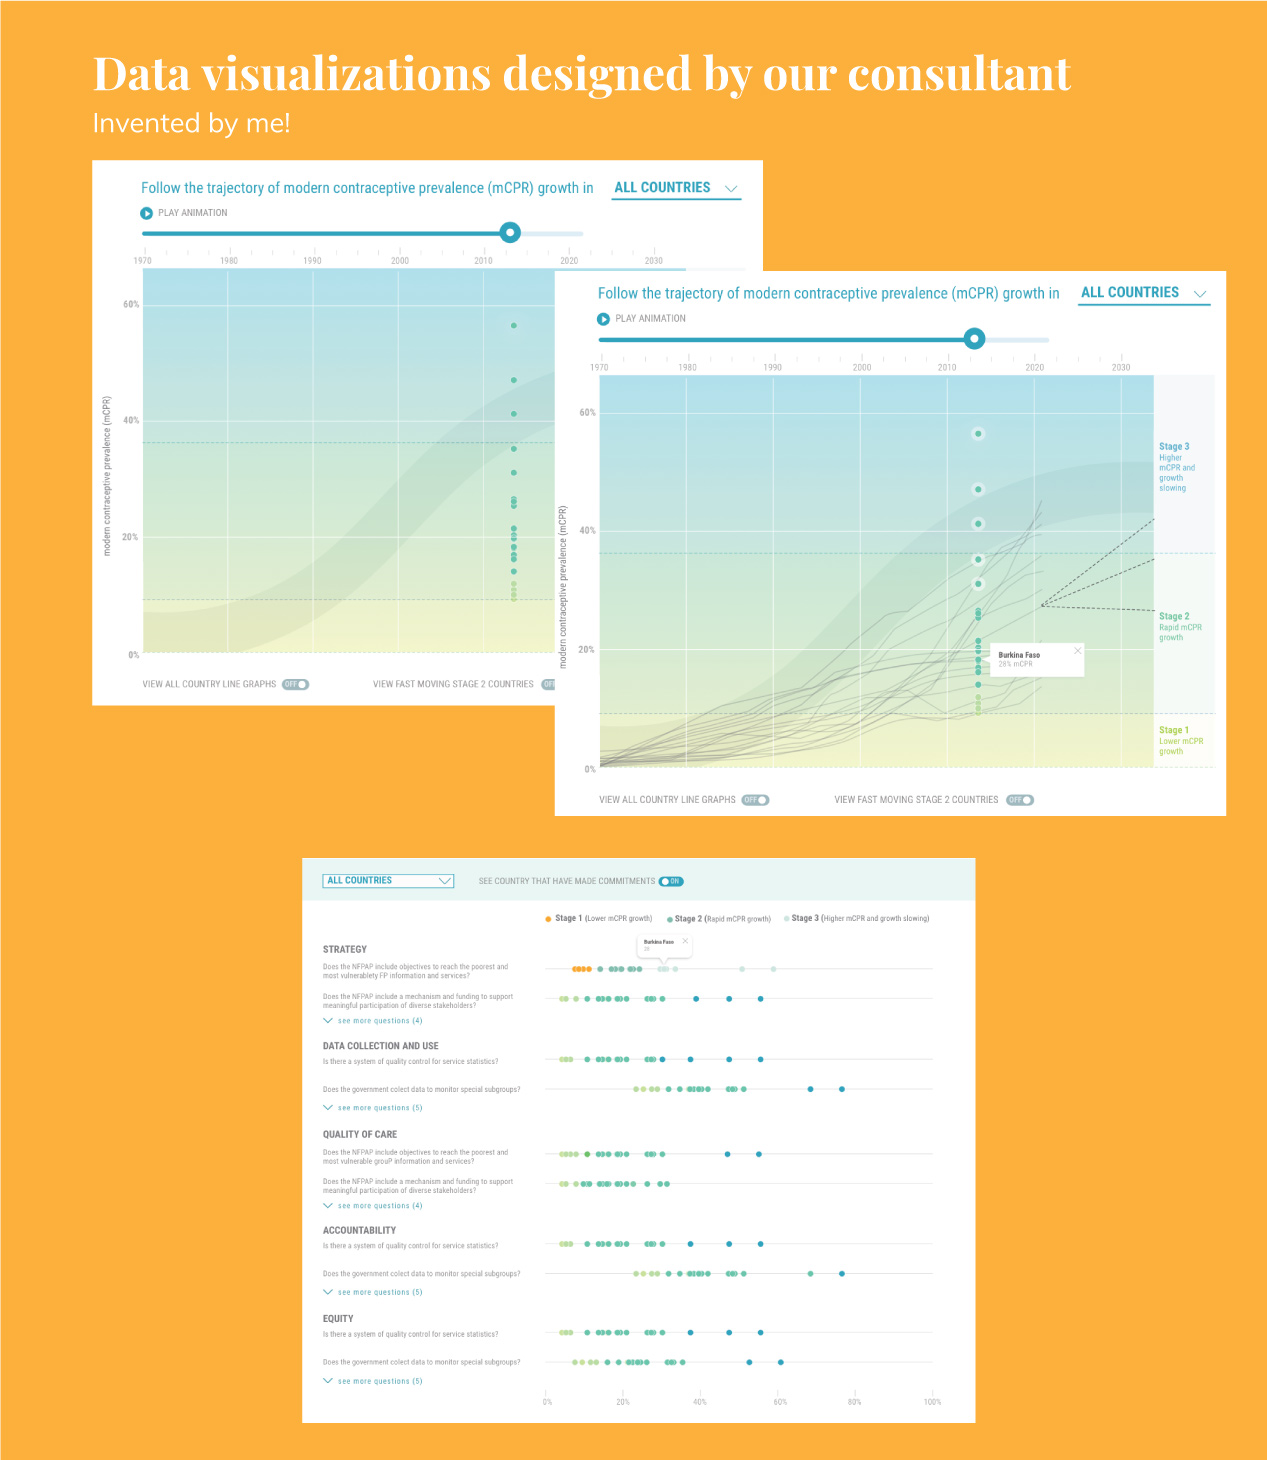
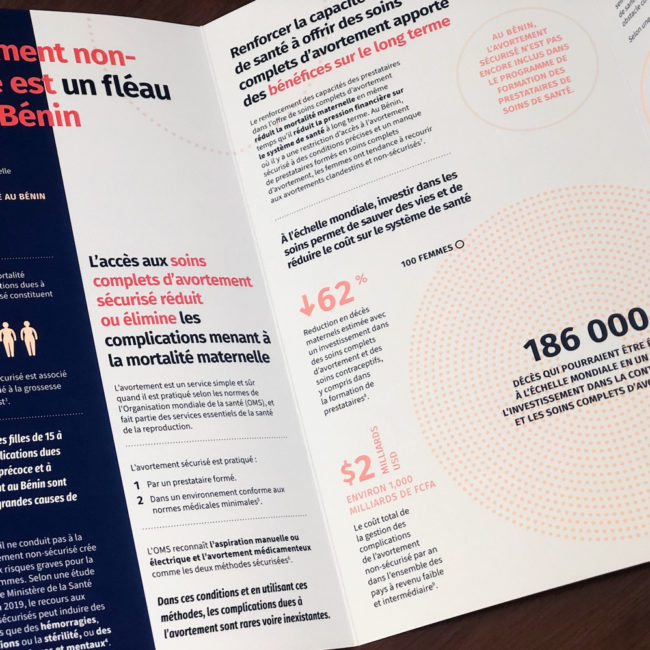
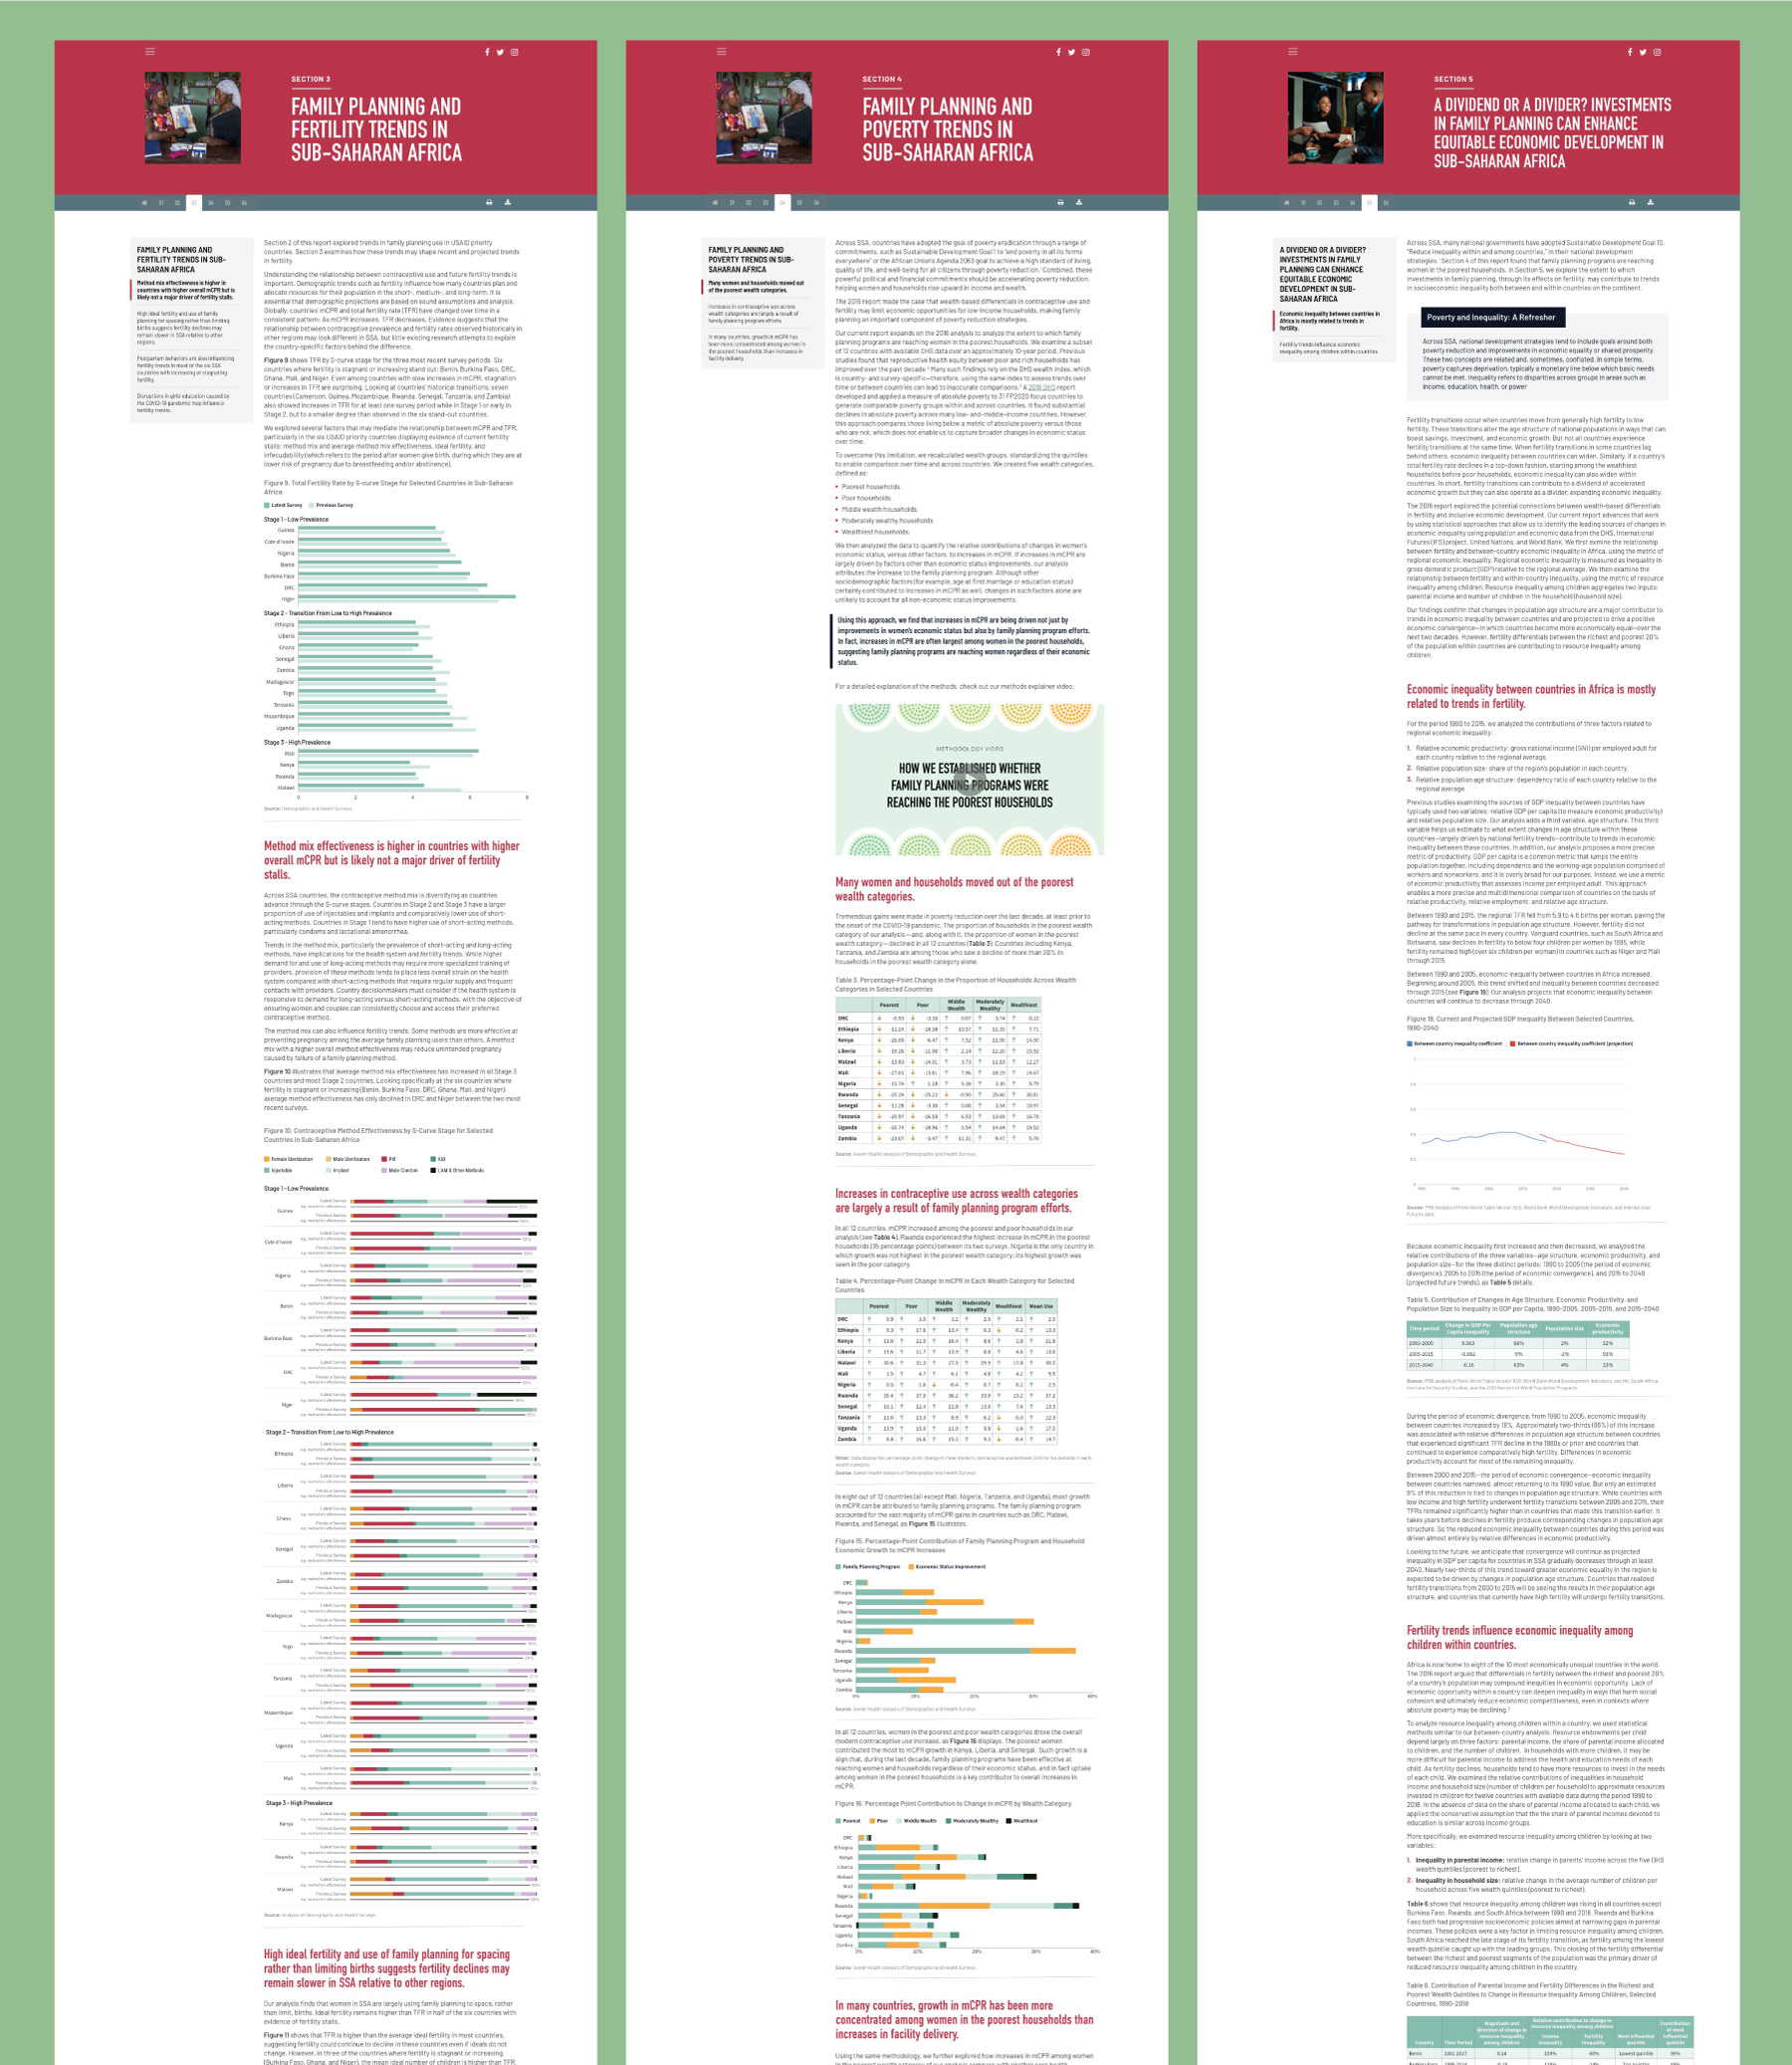
This project was a data viz-intensive project, ultimately featuring 26 charts, graphs, and tables. I touched every piece of data for the site and designed each figure in the high-fidelity wireframes.
For some of the simpler charts, it was just a matter of ensuring the data file was clean and easy for the developers to pull into their code. Others involved internal discussions with the client to ensure we had selected the right chart type for the data.
For three visualizations, we actually hired an outside data viz team to help us brainstorm and mockup more complex concepts in Sketch.
We did not set out thinking a full prototype of the site would be needed, but it soon became clear that this would be an important asset for the development of this site.
Using the design we had created with the agency up to that point, I worked in Adobe XD to create a high-fidelity design of the site including final content and designs for every data visualization on the site.